1
Evaluation
To evaluate large-scale perspectives, their related concepts, and local projects�in
relation to each other, a common legend and vocabulary is required by which existing
situations and plans on different levels
of scale�can be compared. Such a vocabulary is developed for the
Metropolitan Debate [Jong, 1998 #410][1]
and summarized below.
The concept of �metropolis� changes in time. Amsterdam in the 17th
century was a world city of� 100,000
inhabitants in a radius of approximately one kilometre, a built-up area now we
would call a village. One can describe a metropolis functionally,
structurally or morphologically. The concept of function, however, is senseless without a presupposed structure, a set of separations and connections,
specializations and integrations, within which the function is fullfilled.
Structure on its turn cannot be imagined
without a form, a state of dispersion of
components in space.
Functionally we can follow the description of Frieling: a concentration of population where decisions
of high quality can been made quickly, is a metropolis. The meant quality
concerns the social feasability (public support) and (to the mondial top of the
pyramid of decisions) a world-wide (metropolitan) tenor. It supposes spatial
and temporal freedom of choice. Such freedom, however, presupposes
an urban and rural diversity in use and experience. Freedom, sustainable
possibilities of choice, and diversity are on their turn conditions for
decisions of high quality.
A structural description concerns the
connections and separations of the inhabitants, making that freedom of choice
in space and time acually possible. The inhabitants should be able to reach
eachother easily, in the same time not causing trouble to eachother. The
connections are often emphasised, the necessary separations are often
forgotten. The combat against criminality, the risk- and watermanagement, the
demands of the environment, the defence of privacy, often require spatial,
ecological, technical, economic, cultural or administrative separations (distances,
dikes, fences, walls, entrance fees, financial, informational or legal
barriers). Emphasising connections, one could describe a metropolis as an urban
area with an underground railway. A city covering, largely underground traffic
facility is an indicator of a public need for horizontal connection and
vertical separation in a metropolis.
In this manual, however, I choose a
morphological definition: a metropolis is a residential area of 10 million
inhabitants within a radius of 30 kilometer. These nominal measures should be
interpreted elasically. By �30km� for example I mean a value between 10 and
100km. Such a logarithmic margin concerns any measure below including
population numbers. By this morphological definition, functions, their
unpredictable dynamics and supposed structures are not considered themselves,
but their possibility on the basis of any state of dispersion (form) are. This
kind of description also applies to networks and green areas like landscapes�(areas
with less than 1 million inhabitants within a radius of 30km), landscape parks�(less than 100,000 inhabitants within a radius of 10km), citylandscapes�(less
than 10,000 inhabitants within a radius of 3km) and so on. By that, such areas
become comparable and their composition becomes debatable[i].
1.a State of dispersion
In the figure below, globally and tentatively
the population of Paris, London and the Randstad are indicated by circles of
1,000,000 and 100,000 people. These circles in the scale of the drawing have
got a determined measure of 10km (�agglomeration� in a morphological sense) and 3km (�city�), because they represent quite
well the urban area needed in the Netherlands by these populations
(approximately 300m2/inhabitant).�
When the circles overlap, the population
density�is apparently higher than elsewhere on average in the Netherlands.
Through that the density and state of dispersion within any arbitrary boundary
is directly visually readable from drawing. Concepts of density by this
representation are automatically articulated to different levels of scale. �Regional density� (density within a radius of 30km),
�agglomeration density� (10km�[2]),
�urban density' (3km�)
en so on, are different concepts of density after all[ii].
In the drawings below, several �villages� are swept together to one �virtual
city� of 100,000 inhabitants (dotted) each time, to represent the total
population of the region.
|
|
|
|
|
Figuur 1 Paris, London, Randstad |
|
|

1.a.1 Open spaces
Subsequently
in a region within a radius of 30 kilometre one can find directly and visually
areas with less than 1,000,000 people (�landscapes� in a
morphological sense). If that is impossible, one can perhaps find areas with
less than 100,000 people within a 10km radius (�landscape parks�)� or areas with less than 10,000 inhabitants
within a 3km radius (�city landscapes�).� Drawing them as green circles, the
composition of the region is expressed with enough freedom of interpretation to
further design and on the other hand enough accuracy to evaluate important
effects. This �pointillistic� representation not only suits an interpretation
of the existing situation, but also the interpretation of changes and more
global concepts. The difference between two compositions in this legend
satisfies the requirements to analyse spatial, ecological, technical,
economical, cultural and administrative impacts.
This way, in the Randstad�one can
distinguish 5 potential �national landscapes�: the �Venen�, the
�Vechtplassen�-area and the northern, southern and eastern �Waarden� (see the
figure of Randstad above). That�s why we spoke about a �Green Metropolis� and when the recent demands for
water area are rewarded we will speak about a Deltametropolis.
The Green
Heart, however, becomes more and more red. In the
figure below the development between 1965 and 1990 is summarized. The drawing
in the middle is a tentative interpretation of the situation in 1965, the
drawing right of 1995 and the drawing left shows the real difference.
|
|
|
|
|
Figuur
2 Randstad development between 1965
and 1990 |
|
|

The Randstad in 1965 consisted of the
well-organized regions Amsterdam and Rotterdam, separated bij the river Oude
Rijn between Leyden en Utrecht, old Dutch university cities like Oxford and
Cambridge. The Green Hart with its �villages� (10,000 inh. within 1km�)
was only interrupted by Gouda. In the figure most right the agglomerations from
the drawing in paragraph 1.2 are shown more in detail as �city sectors�
(100,000 inh.) or contiguous �districts� and dispersed �villages� (10,000
inh.).
To spare the landscape, the sprawl was
controlled by the strategy of �Bundled
Concentration� since the Second National Plan of
Spatial Policy[3]
in 1966 and by the strategy of �Compact
City� since the Third National Plan of
Spatial Policy[4]
in 1983. In the figure below, 3 strategies are represented by which an
agglomeration of 1,000,000 inhabitants could grow by 100,000 inhabitants.
|
|
|
|
|
Figuur 3 Possibilities of extension,
dispersion and describing agglomerations |
|
|

Concentration�(C) in
a radius of 30km leaves unimpeded a possibility of Deconcentration�(D) in a radius of 10km and the reverse. There are 4 �accords�
then: C30kmC10km (Double Condensation), C30kmD10km,
(Compact City), D30kmC10km (Bundeled Deconcentration) en
D30kmD10km (Double Sprawl). Double Sprawl fragments the
landscape in smaller green city landscapes than the other accords (horizon free
landscapes of 30km radius or landscape parks of 10km radius offering runback to
the cities). Bundled Deconcentration (DC) breaks up the landscape in landscape
parks. Compact urbanization (CD) spares the landscape, and condensation within
a radius of 10km (CC) hardly contributes[iii].
The spatial impact analysis here is directly
viualized. The myth of an important contribution by condensation on
agglomeration level can be unmasked by this representation. A thought
experiment may clarify that. The Dutch population (16,000,000 inh.) could be
concentrated in 15 nationally regularly dispersed agglomerations. National
deconcentration than is combined with regional concentration leaving unbuilt 10
horizon free landscapes with or without condensation on the level of the
agglomeration. Bundled Deconcentration, however, would break up such landscapes[iv].
1.a.2 Networks
Scale articulated reasoning carried further to
connections leads to the next legend[v]:
|
NETWORK |
BLUE LEGEND |
BLACK LEGEND |
|
|||
|
density |
mesh/ exit interval |
width 1% |
NAME |
width |
NAME |
|
|
km/km2 |
km nominally |
m nominally |
|
m nominally |
|
|
|
0,002 |
1000 |
�10000 |
sea |
|
|
|
|
0.007 |
300 |
3000 |
lake |
300 |
continental highway |
|
|
0,02 |
100 |
1000 |
stream/pond |
200 |
national highway |
|
|
0,07 |
30 |
300 |
river/waterway |
100 |
regional highway |
|
|
0,20 |
10 |
100 |
brook/canal |
80 |
local highway |
|
|
2,00 |
3 |
30 |
race |
50 |
city highway |
|
|
|
|||||||
|
Figuur
4 Scale articulation of networks |
|||||||
|
|
|||||||
The density of exits or crossings on the own
level is normative for network density. This unit has more relation with ride
length than with traffic intensity. In connection with the red and green legend
one can imagine their superposition�as
follows:
|
|
|
|
|
|
|
Figuur 5 Superposition of networks |
|
|
|
|


Superposition of the higher order over the
lower order, the density of the lower order decreases[vi].
By superposing the wet connections over or
under the drye connections, both networks interfere (interference). This can be done in different ways.
Separating instead of bundling them fragments space more. The diversity of
interference has important ecological and cultural identity impacts.
1.a.3 The functional charge of form and size
Form, size and structure of components are conditions�for the
function of the urban area and its surroundings, though function can be the historical
cause�of form and structure.
|
|
|
|
|
Figuur
6 Functional charge of open
space |
|
|

In the figure above H+N+S shows possibilities of use�by animals and men conditioned by form and size of green areas. The
possibilities of use of red areas conditioned by form and size could be
schematized in the same way, but the figure would become very large and
complicated[vii].
1.b Evaluating local projects in national concepts
Individual projects increasingly come into conflict
with national and regional concepts creating conditions for other functions in
a more remote future. Because economic considerations are most decisive,
projects, their costs and regional concepts have to be visualized in the same
drawing. In the figure below left urbanization is represented in terms of
existing capital (� 500,000,000/big spot 300m�,
�50,000,000/small spot 100m�) and investment in new projects
(open spots in the figure left).
|
|
|
|
|
|
|
Figuur
7 Urban capital in spots of �500,000,000 |
Figuur 8 Perspective �Stedenland� |
|
|
|


The urban capital in the Netherlands amounts to
approximately �500,000,000/km2.
This coincidence opens the possibility to fill the urban area with a grid of
300m� spots every km. By that, the� real surface is nearly exacly covered with
the figures of the national accounts. In the visualized national accounts the
capital stored in infrastructure is nearly lost compared with the capital,
invested in built-up area. The broader perspective of national
concepts represented in the earlier explained legend can be layed over this
existing and projected capital to weigh them visually. In the figure above
right, the perspective �Stedenland�[5]
as a basis of the 5th National spatial policy plan[6]
is quantitatively interpreted that way[viii].
The thickness of the lines represents the estimated administrative and
financial effort. The existing situation then can be drawn by the thinnest
lines.
|
|
The perspective of �Stedenland�
contains a number of presuppositions about the future material and social
context summarized in the opposite diagram, important to evaluation. It
supposes national active (!) and regional following (?) administration. The traditional
(<) view of well-bordered cities on (sub)national level contrasts with the
supposed regionally experimental culture (>) of high density urban areas
contrasting with empty rural areas. The plan is made in the expectation of
(sub)national economic growth (+), national specialization (/, �distribution
country�), functionally all-round regions (x), and (sub)�national ecological
diversity. In the lowest line the expected dispersion accord CCCDD (compact
city) can be recognized. |
|
|
|
|
Figuur 9 Presuppositions about the future |
|
|
|

To reach a quick and high-quality decision
making worthy of a metropolis, projects should be placed in a perspective on
the appropriate level of scale[7].
This makes them comparable, necessary to social and material evaluation[ix].
1.b.1 An example of 3 designs made accessible for evaluation
In 2001 the design bureaus TKA, Hosper and
H+N+S made designs for a district in Almere. The project contained
approximately 50,000 new inhabitants.
|
|
|
|
|
|
TKA |
Hosper |
H+N+S |
|
|
|
|
||
|
Figuur 10 Three plans for Almere Pampus |
|
||
|
|
|
||


The designs had to be compared and evaluated
ecologically, technically and economically. The plans, however, varied in
legend and capacity. Firstly they were redrawn in the above described legend by
spots of 1,000 inhabitants (100m�), giving some idea of the form
(state of dispersion) and difference in local density. The frame of the figures
below is 10 x 10km.
|
|
|
|
|
TKA�
58,000 inh. |
Hosper 53,000 inh. |
H+N+S 44,000 inh. |
|
|
||
|
Figuur 11 Three plans interpreted for
evaluations |
||
|
|
||


Next they were �interpolated� or �extrapolated�
to the same capacity to make the ecological comparison fair. A �zero-variant�
was added.
|
|
|
|
|
|
Zero-variant |
TKA
�living� |
Hosper
�recreation� |
H+N+S
�nature� |
|
|
|||
|
Figuur
12 Interpolation�and extrapolation�to 4 views of 50,000 inh. |
|||
|
|
|||


The interpolation (extrapolation) required some
redesign, especially when locally higher or lower densities were ne�cessary.
The design of TKA even lost a neighbourhood over the western dike by that
intervention. The Zero-variant represents a nearly homogeneous living,
recreation, and nature environment. The designs give possibilities of
morphological, structural and functional differentiation. The TKA design included space for
offices and business, while the other designs did not. They were added in the
other designs so the land use figures on the level of the district became the
same.
1.b.2 Application
To compare and evaluate plans, strategies or
projects easily in a decision process, they have to be drawn in the same way.
Quantitive data and their location should be read from drawing visually at a
glance. In the above paragraps a method is given to reach that aim in a design
relevant way. In all exercises such a �programme check� is obligatory. The
�perspective sjabloon� gives a possibility to calculate the surfaces easily
only by filling in the blank values. In the example below the perspective
�ruimtedruk� is filled-in.
|
|
|
�within district� |
|||||||||||||
|
absolute |
|
inhabitants |
total surface Delta-metropolis |
of which distributable living |
work |
public infrastructure |
green |
|
water |
|
|||||
|
values |
|
2000 |
2030 |
2000 |
2030 |
2000 |
2030 |
2000 |
2030 |
2000 |
2030 |
2000 |
2030 |
2000 |
2030 |
|
|
|
inh |
|
km2 |
|
|
|
|
|
|
|
|
|
|
|
|
''district area'' |
|
x1000 |
|
|
|
|
|
|
|
|
|
|
|
|
|
|
central urban |
|
710 |
1.003 |
118 |
160 |
51 |
80 |
25 |
40 |
8 |
9 |
26 |
22 |
8 |
8 |
|
urban |
|
2.818 |
2.841 |
538 |
630 |
242 |
288 |
44 |
66 |
39 |
45 |
186 |
204 |
27 |
28 |
|
green urban |
|
415 |
666 |
356 |
387 |
54 |
112 |
20 |
41 |
19 |
22 |
242 |
192 |
21 |
21 |
|
village |
|
1.337 |
1.583 |
1.614 |
1.438 |
169 |
249 |
45 |
79 |
64 |
74 |
1.208 |
905 |
128 |
131 |
|
rural area |
|
251 |
427 |
929 |
845 |
49 |
112 |
14 |
26 |
31 |
36 |
783 |
618 |
52 |
53 |
|
work area |
|
512 |
467 |
765 |
859 |
58 |
62 |
139 |
210 |
67 |
78 |
447 |
454 |
54 |
55 |
|
|
|
6.043 |
6.987 |
4.320 |
4.320 |
623 |
904 |
287 |
461 |
228 |
264 |
2.892 |
2.395 |
290 |
296 |
|
|
|||||||||||||||
|
Figuur 13 Dispersion of functions within 6 categories of districts |
|||||||||||||||
|
|
|||||||||||||||
|
relative |
|
dwelling
occupation |
|
density |
living |
work |
infrastructure |
green |
|
water |
|
||||
|
factors |
|
2000 |
2030 |
2000 |
2030 |
2000 |
2030 |
2000 |
2030 |
2000 |
2030 |
2000 |
2030 |
2000 |
2030 |
|
|
|
inh/dwelling |
dw/ha |
dw/ha |
apl/ha |
|
% |
% |
% |
% |
% |
% |
|||
|
|
|
|
|
district |
ngbh |
|
netto |
|
|
|
|
|
|
|
|
|
central urban |
|
2,1 |
1,9 |
29,2 |
32,7 |
67,6 |
65,0 |
254,0 |
204,6 |
6,8 |
5,8 |
22,2 |
13,6 |
6,8 |
5,1 |
|
urban |
|
2,2 |
2,1 |
23,5 |
21,7 |
52,4 |
47,5 |
160,7 |
125,5 |
7,2 |
7,2 |
34,6 |
32,4 |
5,0 |
4,4 |
|
green urban |
|
2,3 |
2,2 |
5,0 |
7,9 |
33,0 |
27,4 |
105,0 |
71,8 |
5,3 |
5,7 |
67,9 |
49,5 |
5,9 |
5,5 |
|
village |
|
2,6 |
2,4 |
3,2 |
4,5 |
30,5 |
26,2 |
84,2 |
65,9 |
4,0 |
5,1 |
74,8 |
62,9 |
7,9 |
9,1 |
|
rural area |
|
2,5 |
2,3 |
1,1 |
2,2 |
20,4 |
16,2 |
65,7 |
48,1 |
3,3 |
4,2 |
84,3 |
73,1 |
5,6 |
6,3 |
|
work area |
|
2,4 |
2,3 |
2,7 |
2,4 |
36,0 |
32,7 |
50,9 |
44,0 |
8,8 |
9,0 |
58,4 |
52,9 |
7,1 |
6,4 |
|
|
|
2,3 |
2,2 |
6,1 |
7,5 |
42,0 |
35,8 |
95,2 |
76,0 |
5,3 |
6,1 |
67,0 |
55,4 |
6,7 |
6,9 |
|
|
|||||||||||||||
|
Figuur
14 The same as Figuur 13 in relative measures |
|||||||||||||||
|
|
|||||||||||||||
The accompanying table �ruimtevraag� is
automatically adapted. The filled-in surfaces will be found back in the
involved column, translated in concerning circles to be drawn in the programme
check.
|
|
|
|
|
|
|
2000 |
Ruimtedr. |
Compet. |
Spreiding |
Own.per. |
||||||||||
|
Surface living area in km2 |
2000 |
Ruimtedruk |
Competitie |
Spreiding |
Own persp. |
3km� |
1km� |
300m� |
3km� |
1km� |
300m� |
3km� |
1km� |
300m� |
3km� |
1km� |
300m� |
3km� |
1km� |
300m� |
|
central urban |
51 |
80 |
84 |
73 |
0 |
1 |
7 |
2 |
2 |
7 |
6 |
2 |
8 |
9 |
2 |
5 |
4 |
0 |
0 |
0 |
|
urban |
242 |
288 |
295 |
248 |
0 |
8 |
5 |
0 |
10 |
1 |
7 |
10 |
3 |
9 |
8 |
6 |
11 |
0 |
0 |
0 |
|
green urban |
54 |
112 |
112 |
109 |
0 |
1 |
8 |
2 |
3 |
8 |
6 |
3 |
8 |
7 |
3 |
7 |
6 |
0 |
0 |
0 |
|
village |
169 |
249 |
248 |
226 |
0 |
5 |
8 |
8 |
8 |
7 |
4 |
8 |
7 |
0 |
7 |
8 |
10 |
0 |
0 |
0 |
|
rural area |
49 |
112 |
114 |
109 |
0 |
1 |
6 |
6 |
3 |
8 |
8 |
4 |
0 |
2 |
3 |
7 |
6 |
0 |
0 |
0 |
|
work area |
58 |
62 |
65 |
57 |
0 |
2 |
0 |
5 |
2 |
1 |
9 |
2 |
2 |
6 |
2 |
0 |
0 |
0 |
0 |
0 |
|
Totaal |
623 |
904 |
918 |
822 |
0 |
18 |
34 |
23 |
28 |
32 |
40 |
29 |
28 |
33 |
25 |
33 |
37 |
0 |
0 |
0 |
|
|
||||||||||||||||||||
|
Figuur 15 Spots to draw in different
perspectives |
||||||||||||||||||||
|
|
||||||||||||||||||||
To meet better the dispersion characteristics
of the design, a circle of 3km� can be represented as 10 circles of 1km�, a circle of 1km� as 10 of 300m�. The colour of living areas should be red, not
devided in �central urban�, �urban� and so on, because the sprawl of locations
tells that story already.
The colours should
instead represent the other tables of �ruimtevraag�: work (purple),
infrastructure (grey), green (green), eventually divided in parks, sport,
recreation, nature and agriculture (increasing lighter tints of green to yellow
or white) and water (blue).
Draw the existing
situation (2000) in thin lines, and make the proposed new projects recognizable
with thicker lines according to the expected financial effort, found in the
�perspectiefsjaboon�.
1.c Environmental criteria for evaluation
There
are four national policy�documents with environmental criteria for plans on different
levels of scale from the Ministries VROM[8],
LNV[9]
and V&W[10]:
- The 5th National
Plan of Spatial Policy [VROM, 2 001b #840],
- The National Plan of Nature
Policy [LNV, 2 000a #810],
- The 4th National
Plan of Environmental Policy [VROM, 2 001a #839],
- The 4th National
Plan of Watermanagement Policy [V&W, 1998c #829] (stressing
environment), and
- its last successor �Anders
omgaan met water�[V&W, 2 000b #832] (stressing security).
Some of
these policies are elaborated in a regional
policy. The RIVM[11]
is supposed to test plans on the subjects of health, environment and nature. I
will summarize some of the criteria.
|
|
|
|
|
Figuur
16 Four current national plans concerning the
environment |
|
|

1.c.1 Space
The claims�as mentioned in the 5th National Plan of Spatial Policy�[VROM, 2
001b #840] are summarized below left. The expected shrinkage of agriculture
surface cannot compensate the growth of other claims to the needed zero on the
fixed surface of Deltametropolis. So, many claims will not be satisfied or
perhaps be solved in space-saving combinations. From the drawing on page 135 of the mentioned
plan one can count the claims in the Deltametropolis. Below right these claims
are expressed in km2 and in circles of 1 and 3km occupying the same surface[x].
|
|
Nederland |
|
|
|
Deltametropolis |
|
|
|
|
1996 |
claims |
|
|
claims |
km radius |
|
|
|
km2 |
low |
high |
|
high |
3 |
1 |
|
|
|
|
|
|
km2 |
number |
|
|
living |
2242 |
390 |
850 |
|
210 |
7 |
3 |
|
working |
959 |
320 |
540 |
|
120 |
4 |
2 |
|
infrastructure |
1340 |
350 |
600 |
|
90 |
3 |
1 |
|
nature, recr & sport |
5439 |
4770 |
4770 |
|
970 |
34 |
2 |
|
water |
7653 |
4900 |
4900 |
|
380 |
13 |
3 |
|
agriculture |
23508 |
-1700 |
-4750 |
|
-1050 |
-38 |
7 |
|
|
41141 |
9030 |
6910 |
|
720 |
23 |
18 |
|
|
|||||||
|
Figuur 17 Claims derived from the national
plan |
|||||||
|
|
|||||||
These
circles are drawn at size in the figure below right as described in the �Manual
how to make perspectives and projects accessible for evaluation�. So, 10
circles of 3km radius are put together to 1 circle of 10km radius. In the same
way one can �decompose� any circle in 10 smaller ones to picture more precisely
the location, eventually till the picture has reached a photographic halftone
appearance with countable spots in different colours (pointillistic
representation). This representation for instance shows at a glance the living
environments of metropolitan, agglomeration or urban centre�(1km�[12] or
10,000 people surrounded by 30, 10 or 3km urban area), urban
outskirts�(1km� outside the centre in at least 3km� urban area not bordering on green areas of the
same size), green urban areas�(such
an urban outskirt bordered on at least 1km� green area), village�(1km� surrouded by green areas of the same size) or rural�(0.3km� or 1.000 people surrouded by green areas of at
least 1km�) and the number op people enjoying such living
environments[xi].
|
|
|
|
|
|
|
Figuur
18 Claims dispersed over the surface
[VROM, 2 001b
#840] page 135 |
Figuur
19 The same claims compared with the
existing sprawl of cities and villages in Deltametropolis |


With the
stock of too much paint indicated in the right figure below we can picture many
different perspectives of a future Deltametropolis. We necessarily have to omit
claims. The perspectives�will
not only differ in the specific claims they accept or disappoint, but also in
the way each colour is concentrated in larger units in favour of their own
function or dispersed in smaller ones in favour of synergy with other functions.
Projects�should
support this own function or on the other hand synergy.
1.c.2 Nature
|
|
The
National Plan of Nature Policy�[LNV,
2 000a #810] publishes on page 25 of its programme the newest version of the
accompanying map. Deltametropolis
counts three robust connections[xii]:
The biological identity�of
dispersed natural areas and projects in a large part of Deltametropolis from
this programme and their role as aimed nature type (natuurdoeltype) is elaborated by the Province of
Zuid-Holland and clearly represented on the Internet bij W. Heijligers[13].
On the accompanying map one can zoom in to the level of the nature projects[xiii]. |
|
|
|
|
Figuur 20 [LNV, 2 000a #810] page 25 of its programme |
|
|
|
|
%20page%2025%20of%20its%20programme.jpg)
Perspectives
and projects are evaluated in the way urban areas in the Deltametropolis
reflect this diversity�and
biological identity.
|
|
|
|
|
|
|
Figuur
21 Ecological infrastructure in
South-Holland |
Figuur
22 Quadrant South-East Delft |
|
|
|


The basic
ecological criterion for evaluation is global diversity�lo
leave possibilities open for future life. Diversity on a high level of scale is
operational as rarity�(as
strong identity) on a lower level[xiv].
|
|
Perspectives
and projects are evaluated on the preservation and production of worldwide
(10,000km�), European (1000km�) and national (100km�) rarity of objects[14].
So, rarity can be expressed in km�. The second criterion, important
for planning and design is replacebility�of
removed objects, expressed in years. It evaluates the possibility of compensation�of
rare objects. Once rarity of natural and artificial objects is determined on
different levels of scale, they can be evaluated with regard to their
replacebility. In Figuur 23 living areas of 1km� or
0.3km�
designed and named by TKA TKA
(2001), Hosper Hosper
(2001) and H+N+S H+N+S
(2001) in Almere [Jong, 2001 #82] are located in a diagram
for evaluation. |
|
Figuur 23 Rarity and replacebility of natural and artificial objects |

The product of both gives an ecological value for comparison and subsequent
evaluation. Natural areas are represented generally more right in the diagram,
because they are less replaceble than the mentioned artificial objects.
1.c.3 Physical environment and water
The 4th
National Plan of Watermanagement Policy�[V&W, 1998c #829] (stressing environment), and its last
successor �Anders omgaan met water�[V&W, 2 000b #832] (stressing security)
mark a change from accent on a clean to a secure environment, just as the 4th
National Plan of Environmental Policy�[VROM,
2 001a #839] compared with its predecessors[xv].
Several floodings in The Netherlands and elsewhere in Europe has focused the
attention on global warming�and watermanagement. The future problems and proposed solutions
are summarized in the figures below[xvi].
|
|
In Figuur 24 above most left, global
warming, in the figure right the ground descend�of
the western and northern part of the Netherlands are shown. Bottom
most left, different scenarios of temperature
increase, right of it, the expected increase of precipitation�in
winter and decilne in summer are shown.
|
|
|
|
|
Figuur 24 Expected problems [V&W, 2 000b
#832] |
Figuur 25 Strategies: 1 care, 2 store, 3 drain |
|
|
|


The storage
of water requires heavy surface claims. The lowest areas collect water and
pollution, so local altitude lines, waterlevels�and drain systems�fix the
possibilities and risks for nature and human living. They have to be listed.
Relatively high locations favour both as concurrent functions. Lower areas are
more suited for water.
In the
short term energy saving�by concentration
is important to stop global warming, in the long term sunlight will provide
enough electric energy to sustain the current worldwide demand several times.
The best
indicator of a clean environment is the presence of rare nature. Its greatest thread
is no longer the city but intensive agriculture.
1.d
Critical remarks
As the
perception of the environment of the '60�s has been transformed into objectives
and implemen�ted into regulations, there is hardly a way for critical
reflection. The original objectives lead technical, economical, cultural and
political lives which stand so much on their own that questioning their
pertinency will not be tolerated. In my perception though, when building is
concerned, these measures as they are focused on independently conceived
environmental objectives do not bring about any noticeable ecological effects.
They bear more reference to publicity generating ambitions of local
administrators than to finding a solution to the ecological crisis. These
admini�strators exploit myths that have become self-evident as a cultural
inheritance of the protest generation. And as far as the administrators do not
bear their roots in this protest generation, its members occupy key positions
on a large scale as civil servants, managers and scientists of environment.
Culture is
the whole of non-explicit presuppositions in communication
Science
will break through this silence. I distrust the casualness of unspoken
presuppositions and will make an attempt to demythologize them on the basis of
some challenging propositions which are presented as paragraph titles. I hope
that by doing so, more effective measures�
for the long term future come to the fore.
1.d.1
There are no other ecological problems
but the deterioration of globally valid biodiversity and human health
World
population doubled over the last 40 years from about 2.5 to 5 billion while the
area that can be used for agriculture has decreased with 10 % ( mainly
resulting from erosion) from about 17 to 15 million km2. Space
available for cereals has decreased from about 0.2 to 0.1 hectare per
inhabitant[15]. Something similar can be expected
again within the next 40 years. Production per hectare however has increased
from about 1000 kg to 2500 kg over the last 40 years (green revolution), though
this beneficial development came to a halt by the end of the '80s. This also
attributes to causing renewed erosion. Despite of this, Brundtland c.s. (1987)
assumes a continued growth reaching 5000 kg/ha while the area for agriculture
remains equal. It is desirable and possible that we'll experience this during
the 40 years to come, but it is not very probable.
The nature
of this enormous pressure on our natural environment is loss of global space
and quality through the loss of biotopes (prospects for next generations). The
deficit and loss of biotopes for humans and other life forms leads to two
fundamental environmental problems:
health
problems (that can
be measured in terms of mortality among a human population) and problems of
biodiversity (that can be measured in terms of the decreasing number of
species and genetic diversity within every species). Every environmental issue
(such as acidification, overfertilization, drought, etc.) can be deducted to
these fundamental themes when one keeps on asking long enough: "and why is
this so serious?". It is the common denominator upon which the severity of
environmental problems and the ecological effect of environmental measures can
be judged. Why is the loss of species and depreciation of biodiversity a serious
matter ? Biodiversity is life's insurance. During evolution life has
survived numerous catastrophes through its diversity. There was always a
species, or a specimen that could survive. What we are doing at this very
moment is not only causing big environmental catastrophes, but undermining the
capacity of life itself to withstand such environmental changes . We deplete
the quality reserves of life, i.e. its diversity. Through surface smoothing,
drainage and constant overfertilization, the capacity of nature to conserve and
develop its diversity is taken away from her. The rate of global extinction of
species is about to increase from 3 to 4 per day (some say it is even 6 per
hour); normal generation rates of new species are estimated to be one each year.
The main cause of this is the loss of biotopes. As yet the gain of biotopes is
marginal. For just a few species we optimize the largest areas as monocultures
for the benefit of a little number of species and clones that are useful to the
human race and that rapidly and easily oust deviant specimen and species. It is
especially in this case that (urban) building can provide solutions in design
that will act at the heart of any environmental problem.
Most
environmental measures commonly in use these days in building, hardly
contribute to solve these fundamental problems. At the same time, measures that
could substantially contribute are not implemented.
1.d.2
Depletion of resources (fossil fuels
among them) is not an ecological but an industrial problem
On a global
scale depletion is not an issue. After all, no matter is lost, it is merely
distributed in a chemically altered composition and therefor exploitation
becomes more difficult and will involve higher energy costs. Hence, the image
of the earth burning itself up like a candle is scientifically seen a fraud.
What indeed is running out are biotopes for humans, plants and animals, and
this is partly due to proliferation, contamination, and acidification. The
erroneous definition of the problem of depletion inhibits considering effective
solutions.
1.d.3
There is sufficient energy, also on
the very long term
The
Netherlands, the continental shelf included, (estimated area 80 000 km2)
catches an amount of solar energy (annual average of 100 MW/km2 : 8
TW) almost equal to the total amount consumed by the world economy (10 TW), The
Netherlands uses less than 1 % (0.075 TW) of this. When a photovoltaic cell has
an efficiency of 10 %, then 10 % of the total surface of the Netherlands will
be sufficient for today's national energy supply. The area for agriculture
takes up 30 % at this moment, of which only 20 % is essential in order to be
agriculturally self support�ing. Agriculture can be regarded as the
exploitation of biological solar cells with an efficiency of 1 %.
The photovoltaic
cell has been reduced in price by a factor 14 since 1975 (from US$ 70 to US$ 5
per Watt installed). Again a factor 8 and it will get by the economic
efficiency of fossil fuels.
The last
mile is the longest one. This involves how�ever a kind of technical problem
("neatly slicing sand") that has never been left unsolved over the
last two centuries. In terms of efficiency, the con�ver�sion of solar light
into electricity (in particular when viewed in combination with an environ�mentally
sound version of the heat pump) will outperform other types of solar options,
including wind as transformed solar energy.
1.d.4
Ecologically, building has more
favourable than adverse effects
That
(urban) building after all has been said and done, has a favourable effect on
human health, nobody will deny. Without houses, there would be less survivors.
Why is this positive effect on the human environ�ment never taken into account
in the analysis of the effects of building activities ?
Last year
it was estimated that within the city boundaries of Amsterdam half (800
species) of the entire Netherlands natural flora can be found. In the, 30-years
old, new town Zoetermeer some 500 self generating natural plant species were
counted. This has brought forward the question if certain priorities in wild
life protection should not be positioned in the urban environment. These
favourable effects on the environment are not taken into account, while the
adverse effects of other sectors then building such as soil contamination, and
water and air pollution (as they coincidentally occur within the boundaries of
the urban environment) are attributed to the effects of (urban) building and
for which it is deemed that solutions can be partly found within the field of
(urban) building. Solving problems of other sectors through (urban) building
technology measures (e.g. through the heavily propagated autarkic water
systems) is however little effective. It will lead to an endearing "city
ecology" which, full of ideals from the '60s will burden itself with too
many problems, but will have next to nothing to do with ecology and will
neglect the potentials of its own discipline. The same effort directed towards
the quality of the built environment itself can have a much larger ecological
impact. When a building as a result of its architectural quality or flexibility
will stay in place for a twice as long period, the environ�mental effectiveness
will be doubled. If building a city by using smart urban building technology
will yield twice the number of wild species in the same ratings of rarity as
there were before the city was built, the environmental effectiveness of
surface area will be twice as high.
If we would
cast our fishing nets the other side of our boat when building, the
environmental effect of our profession could well be much higher. The catch on
the side of encouraging beneficial contribu�tions is more bountiful than the
one on the side of limiting adverse contributions. This means that life saving
cities should be built for the massive flight of this era towards the city, and
that these cities should be built in such a way that at the same time new
biotopes for plants and animals will result.
1.d.5
The environmental effectiveness per
unit of prosperity should increase with 2000%
According to Ehrlich and later Speth[16] the total environmental pressure D
matches the size of the population B, its level of prosperity W, and the
environmental effectiveness per unit of prosperity M :
|
D = |
B |
x W |
x M |
In whatever
way these factors are composed, one could imagine that changes within the next
forty years will be something like[17]:
|
1/2 = |
2 |
x5 |
/20 |
World
population will double. The Brundtland committee[18] started from the concept that this world
population and in particular its underdeveloped part should be able to develop
towards an acceptable level of prosperity. As about 75 % of the worlds
population is underdeveloped, it may be assumed that despite the possible
decrease in prosperity for a wealthy minority, the global prosperity level� (W) as whole will increase with a factor 5,
considering the necessary immense increase in prosperity for the rest of the
world population. This development will, according to this committee,
nevertheless need to encompass current demands without limiting the
possibilities of future generations to fulfil their own needs (the original
meaning of the concept of "sustainable development").
To halve
the environmental pressure D in order to regenerate the prospects that we have
come across, the environmental effectiveness per unit of prosperity should be
improved with a factor 20. In numerous technological sectors this is thought to
be attainable[19]. One could compare, for example,
the reduction in space and energy of electronic calculators over the last 20
years.
1.d.6
Building will never reach more than
300 % as long as favourable effects are not optimized
If one
thinks in terms of the existing environmental perception of "depletion,
deterioration, and pollution" then none of the current (urban) technology
measures will attain the required factor of 20. Most of them (such as saving 20
% on the thickness of window casings will not reach beyond a factor 1.2 . In a
very optimistic estimation, an urban building plan could achieve a factor 3,
but a factor 1.5 sounds more realistic[20]. Nevertheless, a factor� 20 can be achieved when recycling instead of
thriftiness is our point of departure, and when for the sake of this we would
not worry too much about the energy concerned.
1.d.7 One sided emphasis on thriftiness inhibits considering solutions by design
Departing
from the idea that the energy problem can be solved, the only option that can
attain a factor 20 is sectional building, i.e. designing building sections in
such a manner that they can be used again in various future architectural
conceptions. The Roman brick concept has been used again and again for 13
centuries. Such a depreciation period is over 20 times that of a modern
building. Sectional building is however material and energy intensive and has
the right to be so. This solution lays outside an environmental perception that
is primarily based on cutting environmental costs. Who walks trough a
broad-leaved forest in autumn and sees the forest throwing away all its solar
collectors every year, will have great difficulty continuing to say that we
learned the myth of thriftiness from nature itself. Proposing something similar
for building would meet with howls of derision. Nevertheless, such ideas can
clear our future.
1.d.8
Phases of increasing ecological
quality
The first
fases of improving ecological quality were the efforts of "environmental
care" and "environmental technology". These phases are not
enough to reach a state of "sustainable building". Therefore we need
to solve the fossil fuel problem by "solar energy". That is a
precondition for the "sectional building" fase. Having solved the
problem of building materials in this way, we can start to think about a kind
of "ecological building" that has really something in common with
ecology.
Before
every effort the improvement of architectonical quality itself is of great
importance for sustainable building.
1.d.9
Designing a diversity of possible
futures
From an
ecological viewpoint the probable future is so bleak, that we can put our hopes
only in improbable, yet possible futures, in any case more desirable ones.
We can not
predict these futures because they are improbable: we can only design them.
Making one single design won't be good enough. The edges of what is possible
can only be explored by designing different and unlikely possibilities,
maximally separated from one another. In this span of what is possible today
rests the freedom of choice of tomorrow.
The future
is impredictable for fundamental reasons, as long as we believe in the freedom
of choice. We cannot predict future choices, but we can make them possible by
diversity. Impredictability is only overruled by diversity. That is the reason
why we were preceded by the evolution of biodiversity.
At six
billion people, fearing technics and technology provides bad advice.
1.e Sustaining design
Creativity means leaving out at
least one self evident supposition. We found a systematic way to examine hidden presuppositions in science and
technology. We temporarily call it 'conditional
analysis' and use it in ecology, design, education and in making computer
programs. It has more to do with possibilities than with probabilities or
necessities[21]. It gives some insight in the
boundaries of imagination and thus design.
It is based on the simple comparison[22] of two concepts A and B, putting
the question 'could you imagine A without B?' and the reverse question.
Temporarily we take in consideration only the pairs of concepts that make
possible a different answer on both questions.
As soon as we can imagine A without
B but B not without A we call A a (semantic) condition for B. As soon as we
find a concept C that we cannot imagine without B but B without C we can, we
have semantically a 'conditional range'
of concepts ABC out of which the hypothesis emerges that we cannot imagine C
without A, but in the reverse we can. Though introspective, these comparisons
turned out to give consensus based on a possibility of falsification[23].
Let us for instance conditionally
compare the ecological concepts Abiotic,
Biotic and Cultural phenomena (A, B and C). I cannot imagine cultural
phenomena without biotic (because culture presupposes at any time living people
and functioning brains), but biotic phenomena without cultural I can (for
instance plants[24]). I cannot imagine biotic phenomena
without abiotic phenomena, but abiotic phenomena without biotic I can (for
instance light, air, water, soil). So the hypotheses to be controlled are: 'I
cannot imagine cultural phenomena without abiotic phenomena, but abiotic
phenomena without cultural I can.'. If we confirm that hypotheses we can draw a
conditional scheme like this[25]:
|
|
It
seems to be a Venn diagram out of set-theory.
But it is not, because set-theory presupposes more than the concept of
presupposition itself. It presupposes for example the concept of 'element'
and any equality of the elements (according to the criterion of the set)[26]. A semantic Venn diagram does not yet
need these and perhaps other presuppositions. The drawn borders are no inward
formulated borders of sets and elements, but outward boundaries of eventually
vague and continuous conception. The ABC model represents phenomena outside
culture, but is itself a concept and thus culture. |
|
|
|
|
Figuur
26 The ABC model |
|
|
|

This raises the philosophical
question whether there is any difference between 'preconception' (presupposition,
assumption) and 'precondition' (prerequisite)
at all. The environmental crisis taught us however that there appeared
preconditions for life we did not preconceive beforehand. We consider 'environment' in an ecological sense as
the set of conditions for life, known or yet unknown.
1.e.1
Anthropocentric
and ecocentric thinking
Let us now try to draw two very
different ecological presuppositions that have a direct influence on the way
people design a landscape or townscape: 'Man is part of nature' and 'Nature is
only a human concept' ecocentrism and
anthropocentrism).
|
|
|
|
|
Figuur 27 Presuppositions about the relation between culture and nature |
|
|

Both suppositions contain a paradox.
The anthropocentric way of thinking would imply that physics and biology ('N') cannot
find anything new from experiment or observation that is not already included
in the existing set of concepts (C) or its combinations[27] (idealistic position). 'The
boundaries of our world are the boundaries of our language.'[28] The ecocentric view however
would imply that we cannot communicate such observations. To take these
observations serious, we have to regard them as a not yet cultural part of the
natural world N (materialistic position).
Let us now consider culture (C) as
an intermediate between the picture ('N') and the portrayed in the natural
world (N). Wittgenstein supposes that the picture and and the portrayed have
their 'logical form' in common. Formal logic however cannot cope with
expressions like exclamations, questions, proposals (like designs) and orders:
they have no logical form. That is what occupied the later Wittgenstein[29]. In my opinion these linguistic
expressions are the very solution to the paradox of ecocentric thinking.
Questions are the definition of an emptiness at the boundaries of knowledge,
proposals and designs are excursions in an unknown, but nevertheless imaginable
and perhaps possible future world.
This brings me to a specification of
culture, creativity, science and art. Culture
is the set of preconceptions in communication. Suppose we had to explicate all
presuppositions of our communication before we could start with it, in that
case we would seldom have time to communicate[30]. Fortunately we don't have to
explicate every time all these preconceptions, we simply take them for granted
and call them culture. That is easy, but it also keeps 'self-evident' concepts
out of discussion. Creativity just
starts with disclaiming these apparently self-evident preconceptions, science starts with doubting them.
Art is a
ripple at the outside boundary of culture denying conventional and adding
unconventional presuppositions by poi�sis[31]. We need art or technique to make
new concepts outside conventional language. Science on itself does not provide
that.
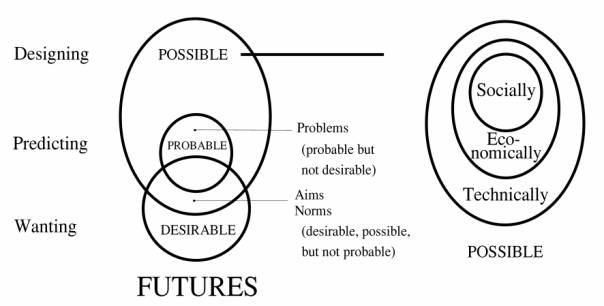
1.e.2
Possible
futures
Probable ecological, economical and
cultural futures are gloomy from a
viewpoint of inevitable environmental developments. But are the probable
futures the only ones that we have to take in consideration? Empirical research is limited to the probable
futures. Design, or technical research is limited to the broader set of
possible ones.
I cannot imagine the probable
without the possible. The reverse I can.
What is probable must be by
definition possible.
|
|
|
|
|
Figuur 28 The modality
of the possible |
|
|
Predicting probable futures requires causal
thinking on an empirical basis. We cannot predict possible futures as far as
they are not probable: we have to design them. They are invisible for
probability-calculations. They are fundamentally ab-normal, outside the 95%-area
of probability. Designs cannot be calculated or predicted. If so, they would no
longer be designs. Design produces possibilities, conditions, freedom of
choice, difference.
Every line a designer draws is a
precondition for further drawing, but not a cause for the rest of the design
process. In the same way the performance of the resulting building, the
behaviour of its inhabitants, is not caused or even necessarily aimed by the
designer, but only made possible in a universum of possibilities opened by the
design. Every line a computerprogrammer writes is a condition for the rest of
the program, but not the cause of its performance. On the other hand one single
missing line can 'ceteris paribus' be called the 'cause' of its break‑down.
In the same way global life has no single cause, but many conditions of which
lacking one on a single place and moment can indeed cause the death of an
individual. Special conditions of sunlight, moist and minerals do not cause
special life‑forms (let alone that they can be aimed by norms of
sunlight, moist and minerals per location), they only make different life‑forms
possible. The relation conditional <> causal has its analogies in the
dualities possible <> probable, designing <> predicting, means‑directed
<> aim‑directed, and probably ecocentric <> antropocentric.
What kind of thinking do we need for
designing research?
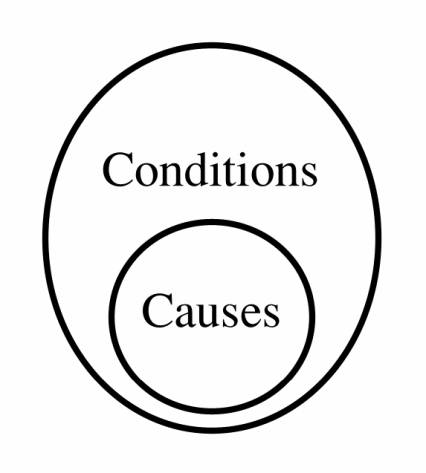
1.e.3
Causal
and conditional thinking
|
|
I cannot imagine causes without
conditions, the reverse I can. We have to make a step back from causal thinking about probabilities
into the broader area of conditional
thinking about possibilities. Every cause is a condition for anything to
happen, but not every condition is
also a cause. The foundation of a
house may be a precondition but not a cause of its existence. Causal thinking
is conditional thinking, but conditional thinking is not always causal. Suppose we read in the paper: 'The
crash of the cars was caused because one of the drivers lost control of his
wheel.' That sounds plausible until an extraterrestrial descends, saying:
'Nonsense, the collision was caused by two objects approaching eachother with
great speed.' |
|
|
|
|
Figuur
29 Causes
under conditions |
|
|
|
If he is right, the paper is wrong, because
if the cars would not have been approaching eachother and one of the drivers
would have lost control there would have been no collision. So it is only a
cause under the tacit precondition of approaching cars. Every causal conclusion
is based on innumerable tacit conditions called 'ceteris paribus presuppositions'.
|
|
|
|
|
Figuur 30 Conditional
thinking as a ceteris paribus environment of causal thinking |
|
|
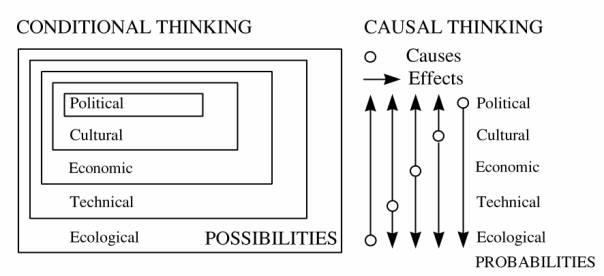
I cannot imagine social possibilities without any economical conditions. The reverse I
can.
I cannot imagine economical possibilities without technical conditions. The reverse I can.
This gives a semantic conditional
sequence of possibilities. In stable technical conditions economical
initiatives can cause technical or social change. But when the dikes burst the
technical 'ceteris paribus' for economical determinism are lacking.
The ceteris-paribus presuppositions
of causal explanations also change on different levels in time. That means
changing causal explanantion. They also can be changed by design forcing
shifting explanation about the effects. Innovative design implies removing some
preconditions and making new ones. Design makes ceteris non paribus.
Innovative
design implicates always removing suppressed conditions and making new ones.
Loose from that conditions change in different wave-lengths:
|
|
|
|
|
Figuur 31 Changing conditions for causal
thinking. |
|
|

Now we can point out a week
component in causal thinking. The ceteris-paribus presuppositions of causal explanations
change on different levels and can be changed by design ... by us.
Professor
Helmar Krupp, former director of the Fraunhofer Institut in Karlsruhe studied
physics, pilosophy and sociology. He came to the conclusion that the individual
no longer can influence the evolution of society. Society behaves as a system
with its own dynamics. Individuals have to submit to this dynamics.[32] In the conference 'The mind of
technology', Delft, 27 november 1996, De Jong tried to comfort him by
emphasising design. The limitations of research could be broken by design.
Probable ecological, economical and
cultural futures are gloomy from a viewpoint of inevitable Schumpeter dynamics
or Fukuyama-expectations. But are the probable futures the only ones that we
have to take in consideration? Empirical research is limited to the probable
futures, design, innovation or technical research to the possible ones. And
that creates hope.
1.e.4
Design
making difference
I cannot imagine a representation or drawing without indicated differences, an (eventually tacitly
presupposed) vocabulary or legend
(key to symbols). The legend is the vocabulary of the drawing. Only by drawing
differences one can make forms and
only by making different forms one can make structures.
Function presupposes a structure
within which the function operates.
|
|
|
|
|
Figuur
32 The legend
and its relation to form, structure and function |
|
|

Nevertheless, within one set of
forms (for example a box of blocks) you can imagine different ways of connecting
them (structures) and within different structures you can imagine different
functions. In the reverse the same function often chooses different structures
and the same structure is often built in different forms or materials. So where
the design process lays the initiative is free. It can be either a causal, aim-directed (purposive) process
starting with the function (funcionalist
position) or a conditional, means-directed
process (formalist or structuralist position).
|
|
|
|
|
Figuur 33 Function,
form, aims and means |
|
|

When the number of aims is smaller than the number of means you better can use aims as independent variable with the means as dependent variable. In architecture and
certainly urban planning the number of means is smaller than the number of aims.
In that case you better can variate the means to see what gives the greatest
amount of possibilities for future generations.
1.e.5
Environment,
the set of conditions for life
Environment
in an ecological sense is the set of conditions for life[33]. In this definition 'conditions'
can be interpreted as ecological, technical, economical, cultural or
administrative preconditions. These substitutions result in 5 different usual
concepts of 'environment': the administrative environment, the cultural
environment etc. The concept 'life' can be substituted in the same sense as
'social life, cultural life, life of men, animals, plants etc, multiplicating
the meanings of the concept of 'environment'.
Building is
a prerequisite for human and other life. Building and urbanization has ecologically more positive effects on the
environment than negative. In contrast with other productive branches it
produces more 'environment' than it costs. It produces an environment for
humans without which they would not survive at the same rate. But it also could
produce a better environment for a variety of plants and animals than many
places outside the built‑up area.
|
|
|
|
|
Figuur 34 Biodiversity in Zoetermeer |
|
|

We learnt that for instance in the Dutch
cities Zoetermeer[34] and Amsterdam[35], where we found 1/3 and 1/2 of the
total amount of botanical species in the Netherlands. Within the city of
Zoetermeer one square kilometre counts even 350 wild self breeding species
outside the gardens. That is 7 times more species than an agricultural square
kilometre in the direct surroundings and as much as a square km in the natural
environment of the Dutch dunes. Of course we cannot say that the value of an
urban ecosystem equals that of the dunes, but we signal a potential that we
could improve. To improve the contribution of urban design to the solution of
the ecological crisis we have to emphasize more the production of positive
effects and its research than the reduction of the smaller negative effects.
|
|
|
|
|
Figuur 35 The development of photovoltaic cells. |
|
|
Let me give another example of
environmentally decisive design. The development of photovoltaic cells can destroy many gloomy prophecies. The
Photovoltaic cell deminished a factor 14 in price since 1975; another factor 8 and
it outruns the economical efficiency of fossil fuels. The only problem is a
cheaper way of slicing sand. The last two centuries technical problems like
that never waited longer than 10 years for their solution.
Let's destroy all gloomy prophecies by design.
1.e.6
The
concept of difference
The very
beginning of any range of semantic conditions seems to be 'difference'. Any concept presupposes 'difference'. Difference on
itself cannot be defined because the concept of 'definition' already presupposes making difference with the rest.
But also the concepts of 'making', 'with', 'the', and 'rest' presuppose
'difference'. So in the sentence concerned, 'difference' was already at least
five times presupposed! Even the concept of equality
(as necessarily presupposed in the concepts of 'gathering' and 'counting' and
therefore in set‑theory and mathematics) presupposes difference. As soon
as you accept that there are 'different differences', for instance more or less
difference ('variation'), you have to
accept that equality is a special case of difference.
|
|
|
|
|
|
|
Figuur 36 Anything differs |
Figuur 37 Difference makes possible |
|
|
|


According to Figuur
37 there should be a more specific relation between
difference and possibility than the conditional one in Figuur
36. However, I did not yet find a more convincing
consideration than a picture like Figuur 37.
Yet this question is essential for
designers. If after all their profession as producers of possibilities has a
specific relation with differentiation, than it has a difficulty with the
accepted scientific practice of generalization.
Ross Ashby[36] and Van Leeuwen[37] noticed that given a difference you
always can imagine more difference, but not always less. The least kind of
difference we call equality. Nevertheless, there must be a difference of place
or moment left to establish that equality, otherwise the comparison has no
sense. So we can draw an important conclusion: equality is a special kind of
difference and not the opposite of it.
Many scientists feel uncomfortable
with that conclusion because their profession is based on equations that
conceive regularities in sets of n>1 'comparable' facts. Designers on the
contrary do not, because their profession is based on originality in every
single n=1 case. Without that originality their design would not be a design,
but a prediction. The very concept 'concept'
presupposes any equality in the observations conceived in the concept, but the
concept 'conception' presupposes
something different from earlier observations. Conceptualization always needs a
reduction of diversity.
|
|
|
|
|
Figuur
38 Perceiving
differences, recognising equaities |
|
|

Vision, hearing, smelling, touching
all need differences or changes in the environment. As soon as there is some
repetition within these perceptions, we 'recognize' it, which is the basis of cognition
and conceptualization. (Re)cognition however is only based on similarity, it reduces the differences that still can
be perceived. So conceptualization changes sometimes chaos in surprize,
sometimes surprize in recognition, sometimes recognition in boredom.
|
|
Causal thinking is a special way of
reducing diversity. It reduces similarities in repeating sequences of
phenomena to the more general concepts of cause-effect relationships. Causal
explanation has the more value the more reduction of different cases is
possible by abstraction. Alas, nowadays there are not so
much phenomena left that can be explained monocausally. They largely have
been explained earlier. What is left are context sensitive effects that can
be caused by many different 'causes' or causes that can bring about many
different effects, dependent on small differences in the environment where
the 'cause' is introduced. Striking a match can cause little damage here, and
big damage there. So monocausal (or 'paucicausal') research shows deminishing
returns, especially on environmental (context sensitive) issues. |
|
|
|
|
Figuur
39 Deminishing
returns of monocausal (or paucicausal) research |
|
|
|

Means and aims can only be chosen on
the basis of a supposed causal relationship between both. Otherwise thinking
about means and aims is senseless. The same means applied here have other
effects as applied there. Apart from that they are also scale-dependent and
therefore subject of misconceptions.
1.e.7
The
importance of diversity in ecology: tolerance and possibility
The curve of ecological tolerance relates the chance of survival of a species or
ecosystem to any environmental variable, for instance the presence of water. In
that special case survival runs between drying out and drowning.
|
|
|
|
|
Figuur
40 Ecological
tolerance in theory and reality. |
|
|

Imagine the bottem picture as a
slope from high and dry to low and wet. Species A will survive best in its optimum.
Therefore we see florishing specimens on the optimum line of moisture (A).
Higher or lower there are marginally growing specimens (a). The marginal
specimens however are important for survival of the species as a whole.
Suppose for instance long-lasting
showers: the lower, too wet standing marginal specimens die, the florishing
specimens become marginal, but the high and dry standing specimens start to
florish! Long-lasting dry weather results in the same in a reversed sense.
Leveling the surface and water-supply for agricultural purposes in favour of
one useful species means loss of other species and increased risk for the
remaining species.
Variety is a risc-cover for life. This is not only true for the variety in the
abiotic conditions, but also for the variety of ecosystems, species and of
genetic possibilities within each species. Life survived many disasters thanks
to biodiversity. In the diversity of life there was always a species to survive
or within a species a specimen that survived. Survival of the fittest
presupposes diversity from which can be chosen in changed circumstances.
Deminishing biodiversity means undermining the resistance against catastrophes.
From the 1.5 million species we know, this century we lost approximately 50000.
So, we not only introduce ecological disasters, but also undermine the
resistance of life against these disasters.
Biodiversity in mankind is a crucial
value in our quality of life. As we are here we are all different and the very
last comfort you can give a depressed person is 'But you are unique'. Diversity
is also a precondition for trade and communication. If production and
consumption would be the same everywhere, there would be no economical life. If
we would have all the same perceptions and ideas, there would be no
communication. It is an important misconception to believe that communication
only helps bridgeing differences. Communication also produces diversity by
compensating eachother and coordinating behaviour by specialization.
Brundtland[38] summarizes the environmental
challenge by stating sustainability as leaving next generations at least as
much possibilities as we found ourselves. But what are possibilities?
'Possibilities' is not the same as economical supply. If our parents would have
left us the same supplies as they found in their childhood, we would be far
from satisfied. 'Possibilities' has to do with freedom of choice and thus
variety. Our converging Schumpeter-economy[39] and Fukuyama-culture[40] leaves no choice. In our search for
the alternative we find everywhere in the world the same hotels, the same
dinners, the same language. This century, the last 'primitive' cultures are
lost and with them an experience of life that no western language can express.
The extremest consequence of this
levelling out would be a world without economy and even communication. If there
are no longer any differences in production factors, exchanging goods and
services would no longer be necessary. If total world wide distribution of
knowledge and consensus would be the result of our communication age, there
would no longer be anything worthwile to communicate. These thought experiments
show clearly that 'difference' is also a hidden presupposition in communication
and economy.
1.e.8
Diversity
and quality
Quality can
be measured in terms of possibilities of use, experience and expectation for
future generations. The way design can sustain a sustainable development in the
sense of Brundtland is to produce more choices for man, animal and plant. If
there were one best solution for all problems of architecture and urban
planning, it would be the worst in the sense of choices for future generations!
This paradox pleads more for diversity than for uniform solutions. Moreover, if
there was an uniform solution, the designer would have no task.
Quality is always a function of
variation. Quality of possible experience moves between diversity and
uniformity, surprise and recognition. One step too far into both sides brings
us in the area of boredom or confusion.
This is a simple conception, already
recognized by Birkhoff[41] and Bense[42], but why dit it not succeed, why is
quality always posed as an unsolvable question?
|
|
|
|
|
Figuur
41 Quality =
f(Variation) |
|
|
.jpg)
Any discussion on variety and thus
variables can fall prey to confuson of scale. That means that even logic and science
as forms of communication are prey to the scale paradox. The paradox of Achilles and the turtle is a beautiful
example of the scale-paradox in time. The turtle says: 'Achilles cannot outrun
me when I get a headstart, because when he is where I was at the moment he
started I'm already further, when he reaches that point I am again further and
so on!'. This conclusion is only incorrect by changing the time-scale during
the reasoning. Something similar is found by Russell on set-theory. Russell[43] bans sets containing themselves and
reflexive judgements as 'I am a liar'.
|
|
The scale paradox means an important scientific ban on applying
conclusions drawn on one level of scale to another without any concern. The
picture shows the possibility of changing conclusions on a change of schale
by a factor 3. There are 7 decimals between a grain of sand and the earth.
That gives approximately 15 possibilities of turning conclusions. Between a
molecule and a grain of sand applies the same. This ban is violated so many
times, that this should be an important criterion on the validity of
scientific judgements. The scale-paradox is not limited
on concepts of diversity. An important example of turning conceptions into
their opposite by scale is the duality of aim and means. For the government
subsidizing a municipality the subsidy is a means, for the municipality it is
an aim. So the conception of means changes in a conception of aim by crossing
levels of scale. The turning of 'Zweckbegriff'
into 'Systemrationalit�t' Luhmann[44]) may be a turning conception of
the same character. In growing organizations integration on the level of the
organization as a whole means often desintegration
of the subsystems and perhaps a new form of integration |
|
|
|
|
Figuur
42 The scale
paradox |
|
|
|

�in the sub-sub-systems. This process is often called 'differentiation'!
1.e.9
Conclusion
The computer sustains the design
process and spatial design sustains or even enlarges our freedom of choice.
Enlarging the diversity of inside and outside space offers after all new
possibilities and thus new freedom of choice. Concerning the possibilities of
future generations of world population since Bruntland, we call the maintenance
of that freedom 'sustainable development'.
Environmental planning takes into account the simultaneously appearing loss of
possibilities and freedom of choice for future generations.
The building process however has in
this sense more positive than negative ecological effects. The best way design
can sustain a sustainable development in the sense of Brundtland, is to produce
more choices (possibilities) for man, animal and plant. If there were one
scientificly tested best solution for all causally formulated problems of
architecture and urban plaming, it would be the worst in the sense of choices
for future generations. This paradox rises when we consider science only as a
method of optimizing probable effects. I would like to state that technical
science has more to do with possibilities than with probabilities.
Computerprogramming not only sustains
design and freedom of choice, it also forces us to make clear hidden
presuppositions and that is the traditional task of art and science.
In that perspective the task of
technical science is to make clear the preconditions (or presuppositions) of technical
performance, the task of technical ecology that of life performance.
The presuppositions about the design
process, as they are differently hidden in a designers' mind and in design
sustaining computer programs, have something in common with the preconditions
of technical and biological performance. If our theory can cope with both, it
will concern a more essential thing about design, building and ecology.
The possibility (the set of conditions) of an event is something
different from a cause (and subsequently the probability) of an event. Every
cause is a condition for something to happen, but not every condition is also a
cause. The design of a house does not cause the behaviour of a household. It
only makes more ways of behaviour possible than there would have been possible
without a house. It allows freedom of choice, offers conditions. In the same
way the design of a computerprogam is
no good when it forces the user into a specific way of thinking, it should give
the opportunity for different ways of thinking. Ecology is the science of
conditions, prerequisites for different life‑forms. Global Iife by its
enormeous differentiation is not monocausal and thus not predictable or
'aimable'. Death of individuals on the other hand, is predictable by pointing
out any essential condition for life lacking. Man as a part of life is
essentially not predictable as long as we believe in freedom of choice.
In ecology, technology, design and
computerprogramming conditional thinking is as important as the operational,
aim‑directed, causal thinking we are used to. The methodology of causal
and probability thinking is largely developed. But what methodology do we need
when we do not only ask questions about the cause or aim of a phenomenon, but
about the conditions under which a phenomenon could possibly appear, its
possibility?