LIVING WITH LIFE
in ecotope
city
Prof.dr.ir.
Taeke M. de Jong, 2002-11-07
2 The importance of diversity for life
3 The importance of diversity for human living
5 Spatial state of dispersion as a condition of
diversity
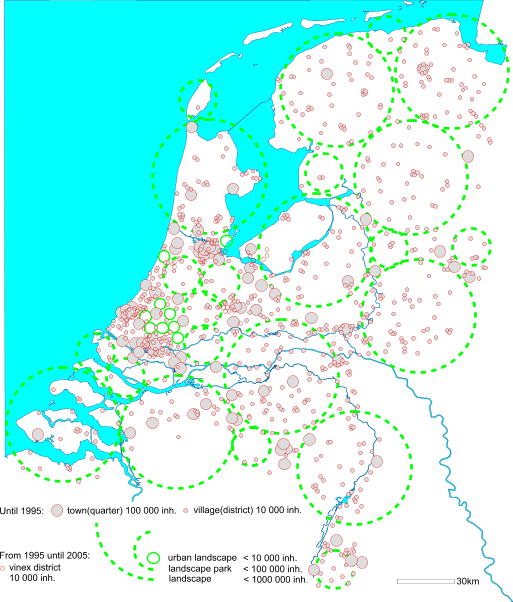
9 Typing urban biotopes or ecotopes
11 Human health in the urban environment
12 Conclusions concerning spatial human rights
1
Introduction
There are
two environmental problems only: the decline of biodiversity and bad human
health.
All other
environmental problem definitions could be derived from this statement.
Depending
on the definition of health[a]
I estimate that roughly 80% of the human population is unhealthy, while some
100 000 species are lost since Linnaeus. The extinction rate is estimated 1000
per year now; the growth in evolution as 1 successful species per year. There
are many estimates on biodiversity described much better than I can do by Van
Zoest (1998).[b] We know some
1.7 million well-described species but much more are unknown. Though we now
know the genome of some, we do not know yet how they work let alone we know
their mutual relations. Even how our own species works is nearly completely
unknown to us, though we already studied 3000 years on this topic. Having some
success in medicine, we seldom understand exactly why. Compared with the
combinatory explosion of unanswered questions we understand almost nothing.
Possible principals punish researchers admitting that honestly and modestly.
Mythmakers win. However, myths may be useful for survival.
Nevertheless,
every state bears its own responsibility in this multitude of species like a
modern Noach. Though The Netherlands occupies less than 0.01% of the earth’s
surface it entails approximately 35000 (2%) of the earth’s number of known
species. Our responsibility is proportional to their global, continental (blue
list), national (red list) or local rareness.
The concept
of rareness and thus responsibility is scale-sensitive.
There are
positive and negative relations between human health and biodiversity. The
impact of biodiversity on human health is unknown. Perhaps a small organism in
some square kilometres of the remaining rainforests is on the long term a
necessary condition for our life by producing tiny quantities of chemical
compounds conditioning processes in our body and mind as catalysts, but we do
not know. How to calculate the risk of loosing them?
The reverse
impact of human health and growth on biodiversity is better known but not
certain.
|
|
|
|
|
Figure
1
Estimated growth of world population |
|
|
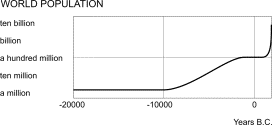
Health is a
scale dependent concept in time. Though world population is not healthy on an individual
level, in the long term we are a healthy species growing in numbers
exponentially ousting other species, living twice as long as some centuries
ago.
And we are
not only expanding in number. Per person we need more and more living space in
our homes and neighbourhoods. In a wider context we reduced the space we need
for agriculture reducing biodiversity in rural areas at the same time.
However,
the intensity of urban use in The Netherlands some 20 years ago was
highest in shops (135 hours/m2year). After shops came offices,
social-cultural facilities, schools, home and garden (48 hours/m2year).[c]
The other hours of the year (counting 8760 hours) in the urban surface may be
available for other species depending on the conditions we leave them by design
and use (distinguished by time scale). Some species accept or even welcome our
presence like that in step vegetation (for example greater plantain, rats,
mosquito’s, sparrows). Could we welcome more rare species in our towns by
creating ecological conditions[d],
ecotope cities? How does it interfere with our health?
2
The importance of diversity for life
Diversity is a risk-cover for life[e]. In the diversity of life there was
always a species to survive or within a species a specimen that survived.
Survival of the fittest presupposes diversity from which can be ‘chosen’ in
changed circumstances. Diminishing biodiversity means undermining the
resistance against catastrophes. From the 1.7 million species we know, we
probably lost some 100 000. So, we not only introduce ecological
disasters, but we also undermine the resistance of life against these
disasters.
|
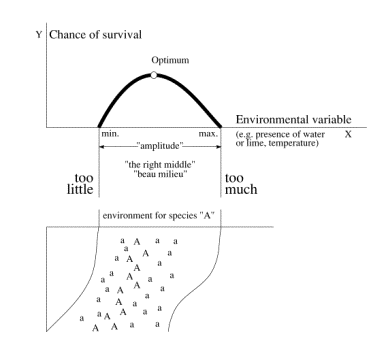
|
The curve of ecological tolerance relates the chance of survival of a species or
ecosystem to any environmental variable, for instance the presence of water.
In that special case survival runs between drying out and drowning (Figure 2). Imagine the bottom picture as a
slope from high and dry to low and wet. Species A will survive best in its
optimum. Therefore we see flourishing specimens on the optimum line of
moisture (A). Higher or lower there are marginally growing specimens (a). The
marginal specimens however are important for survival of the species as a
whole. Suppose for instance long-lasting showers: the lower, too wet standing
marginal specimens die, the flourishing specimens become marginal, but the
high and dry standing specimens start to flourish! Long-lasting dry weather
results in the same in a reversed sense. |
|
|
|
|
Figure 2 Ecological tolerance in theory and reality. |
|
|
|
Levelling the surface and
water-supply for agricultural purposes in favour of one useful species means loss
of other species and increased risk for the remaining species.
But there is a less friendly
ecological lesson hidden within this scheme. Marginal specimens are important
for survival of the species as a whole. A reservoir of unhealthy specimens
favours species. Death regulates life. Health is also spatially
scale-sensitive.
3
The importance of diversity for human living
Biodiversity in mankind is a crucial
value in our quality of life. As we are here we are all different and the very
last comfort you can give a depressed person is 'But you are unique'. Medicine
hardly discovered that evaluating medicines[f].
It hinders generalizing science using concepts as average and standard
deviation. Ecology[g],
organization theory[h] and design
study[i]
are aware of that difficulty. Evolutionary ecology is only comprehensible
considering exceptions outside the limits of a normal test population
(3*standard deviation)[j].
Diversity is also a precondition for
trade and communication. If production and consumption would be the same
everywhere, there would be no economical life. If we would have all the same
perceptions and ideas, there would be no communication. It is an important
misconception to believe that communication only helps bridging
differences. Communication also produces diversity by compensating each
other and coordinating behaviour by specialization.
Brundtland[k] summarizes the environmental
challenge by stating sustainability as leaving next generations at least as
much possibilities as we found ourselves. But what are possibilities?
'Possibilities' is not the same as economical supply. If our parents would have
left us the same supplies as they found in their childhood, we would be far
from satisfied. 'Possibilities' has to do with freedom of choice and thus
variety. Our converging Schumpeter-economy[l] and Fukuyama-culture[m] leaves no choice. In our search for
the alternative we find everywhere in the world the same hotels, the same
dinners, the same language. This century, the last 'primitive' cultures are
lost and with them an experience of life that no western language can express.
After looking at their dancers in the afternoon on our rain forest holyday we
find them back in the disco in the evening.
The most extreme consequence of this
levelling out would be a world without economy and even communication. That is
the ultimate consequence of local autarky. If there were no longer any
differences in production factors, exchanging goods and services would no
longer be necessary. If total worldwide distribution of knowledge and consensus
would be the result of our communication age, there would no longer be anything
worthwhile to communicate. These thought experiments show clearly that
'difference' is also a hidden presupposition in communication and economy. The
question remains on what level of scale self-sufficiency is desired: global,
continental, national, local?[n]
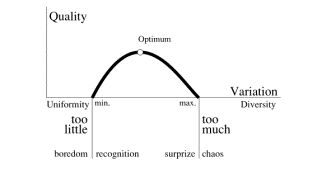
Quality can
be measured in terms of possibilities of use, experience and expectation for
future generations. The way design can sustain a sustainable development in the
sense of Brundtland is to produce more ‘choices’ for man, animal and plant. If
there were one best solution for all problems of architecture and urban
planning, it would be the worst in the sense of choices for future generations!
This paradox pleads more for diversity than for uniform solutions. Moreover, if
there were a uniform solution, the designer would have no task. Quality is
always a function of variation.
|
|
Quality of possible experience moves
between diversity and uniformity, surprise and recognition. One step too far
into both sides brings us in the area of boredom or confusion. This is a simple conception,
already recognized by Birkhoff[o] and Bense[p], but why did it not succeed, why
is quality always posed as an unsolvable question? Because the concept of
diversity is scale sensitive and so is our experience. When on one level of
scale we experience chaos, in the same time on an other level of scale we
could experience boredom. |
|
|
|
|
Figure 3 Quality = f(Variation) |
|
|
|
4
Scale-sensitive concepts
As I mentioned in the introduction,
rareness, responsibility for rare species and even health are scale sensitive concepts.
So is quality. But any discussion on variety and thus variables can fall prey
to confusion of scale. That means that even logic and science as forms of
communication are prey to a scale paradox. The paradox of Achilles and the turtle is a beautiful example of a scale-paradox
in time. The turtle says: 'Achilles cannot outrun me when I get a head start,
because when he is where I was at the moment he started I'm already further,
when he reaches that point I am again further and so on!’ This conclusion is
only incorrect by changing the time-scale during the reasoning. Russell finds
something similar on set theory. Russell[q] bans sets containing themselves and
reflexive judgements, as 'I lie’. This sentence is not only a object statement,
but in the same time a meta-linguistic statement about itself producing a
paradox. When I lie I speak the truth and the reverse.
|
|
The scale paradox means an important scientific ban on applying
conclusions drawn on one level of scale to another without any concern. The
picture shows the possibility of changing conclusions on a change of scale by
a factor 3. There are 7 decimals between a grain of sand and the earth. That
gives approximately 15 possibilities of turning conclusions. Between a
molecule and a grain of sand applies the same. This ban is violated so many
times, that this should be an important criterion on the validity of
scientific judgements. The scale-paradox is not limited
on concepts of diversity. An important example of turning conceptions into their
opposite by scale is the duality of aim and means. |
|
|
|
|
Figure 4 The scale paradox |
|
|
|
For the government subsidizing a
municipality the subsidy is a means, for the municipality it is an aim. So the conception
of means changes in a conception of aim by crossing levels of scale. The
turning of 'Zweckbegriff' into 'Systemrationalität'[r] may be a turning conception of the
same scale-sensitive character. In growing organizations integration on the level of the organization as a whole means often
disintegration of the subsystems and
perhaps a new form of integration in the sub-sub-systems. This process is
called 'differentiation'!
In Figure 4 confusion of scale is already possible by a linear
factor 3 difference in level of scale. That is why in spatial planning we
articulate orders of size by a factor of approximately 3.
|
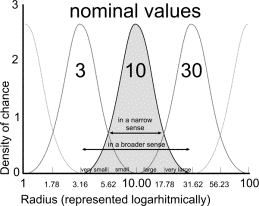
|
An
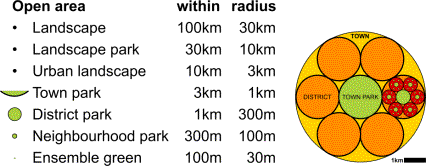
element from the nearly logarithmical series {1, 3, 10, 30, 100 …} is the
name (nominal value) of an ‘elastic’ urban category ranging until those of
the nearest categories (scale range). The name giving ‘nominal’ radius
r=10 then is the median of a chance density distribution of the logarithm of radiuses
between (rounded off) r=3 and r=30, with a standard deviation of 0.15. We
chose a series of radiuses (and not diameters) because an area with a radius
of {0.3, 1, 3, 10km} fits well with {neighbourhood, district, quarter,
conurbation} or loose {hamlet, village, town, conurbation} in every day
parlance. Then also the system of dry and
wet connections could be named in this semi logarithmical sequence according
to average mesh widths. |
|
|
|
|
Figure 5 Names and boundaries of urban
categories |
|
|
|
5
Spatial state of dispersion as a condition of diversity
Form is a
primary object of design presupposes state of dispersion.
|
|
|
|
|
|
|
Figure 6 States of dispersion r=100m |
Figure
7 Accumulation, Sprawl, Bundled
Deconcentration r=30km[s] |
|
|
|
Scale
articulation is especially important distinguishing states of dispersion. State
of dispersion is not the same as density. Considering the same density different
states of dispersion are possible (Figure
8) and that is the case on every level of scale again (Figure 9).
|
|
|
|
|
|
|
Figure 8 States of dispersion in the same density on one level of scale |
Figure
9 One
million people in two states of distribution on two levels of scale (accords
CC, CD, DC and DD). |
|
|
|
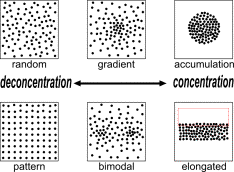
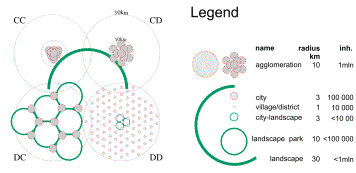
Figure 8 shows the use of the words concentration (C) and
deconcentration (D) for processes into states of more or less accumulation
respectively. Applied on design strategies in different levels of scale we
speak about ‘accords’ (Figure
9).
In Figure 9 the regional density is equal in all
cases: approx. 300inh./km2. However, in case CC the built-up area is
concentrated on both levels (C30kmC10km) in a high conurbation
density: (approx. 6000inh./km2).
In the case
CD people are deconcentrated only within a radius of 10km (C30kmD10km)
into an average conurbation density of approx. 3000 inh./km2.
In the case
D30kmC10km the inhabitants are concentrated in towns
(concentrations of 3km radius within a radius of 10km), but deconcentrated over
the region. The urban density
remains approx. 3000 inh./km2.
In the case
D30kmD10km they are dispersed on both levels.
Urban
sprawl in a radius of 10km hardly influences the surrounding landscape when the
inhabitants are concentrated in a radius of 30 (the two variants above in Figure 9).
However,
the urban sprawl in a radius of 30km breaks up the surrounding landscape in
landscape parks. By that condition the sprawl within a radius of 10km is important
again: the landscape parks are broken up further into town landscapes. In The
Netherlands until 1983[t]
DC was the national strategy (‘Bundled deconcentration’, ‘Gebundelde
Deconcentratie’), after 1983[u]
the policy changed into CC (Compact
town’, ‘Compacte Stad’), but turned out in practice as CD and even DD.
The result
of both strategies was disappointing.
|
|
|
|
|
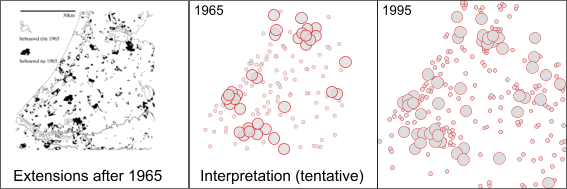
Figure
10 Urban sprawl in Randstad, The
Netherlands |
|
|
In prominent
ecology textbooks there are several definitions of ecology emphasising
dispersion or with an increasing awareness of scale (in that case we will speak
about spatial distribution):
•Andrewartha
(1961), cited by Krebs (1994):Ecology is the scientific study of the distribution
and abundance of organisms.
•Krebs,
C.J. (1994)[v]: Ecology is
the scientific study of the interactions that determine the distribution
and abundance of organisms.
•Pianka
(1994)[w]:
Ecology is the study of the relationships between organisms and the
totality of the physical and biological factors affecting them or
influenced by them.
•Begon,
Harper and Townsend (1996)[x]:
Ecology is the scientific study of the interactions that determine the
distribution and abundance of organisms, populations and communities.
Kolasa[y]
seems to be the only ecologist aware of scale articulation.
|
|
Pianka
stresses relationships in a broader sense than spatial relationships, but he adds
a scheme stressing scale in space and time. ‘Community and ecosystem
phenomena occur over longer time spans and more vast areas than suborganismal
and organismal-level process and entities. (after Anderson (1986) after
Osmund et al.)’ Begon, Harper and Townsend distinguish organisms,
populations and communities. That distinction looks like a distinction of scale, but is primarily
a distinction between different kinds of ecology: |
|
|
|
|
Figure
11 Diagrammatic representation of
the time-space scaling of various biological phenomena. |
|
|
|
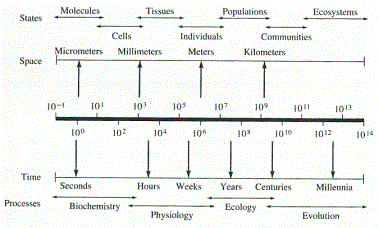
- autecology concerning
populations of one species at a time and
- synecology concerning the
community of different species in the same ‘biotope’.
On the level
of organisms one could speak about ‘ecological behaviour’ as for instance Grime[z]
elaborated as plant species bound ‘strategies for survival’ like ‘competitors’,
‘ruderals’ and ‘stress tolerators’ as rôles in a play concerned less
predictable than communities reaching a well described ‘climax’.
6
Ecologies
Besides
autecology and synecology we know environmental science emphasising human
society and health, cybernetic ecology emphasising space-time relationships, system
dynamics ecology stressing abiotic points of departure and chaos ecology
stressing unpredictability from minor earlier events.
Their
approach and terminology differ substantially:
|
|
naming
abiotics |
naming
biotics |
|
environmental
science |
environment |
human society |
|
autecology |
habitat |
population |
|
synecology |
biotope |
life community |
|
cybernetic
ecology |
abiotic variation |
biotic variation |
|
system
dynamics ecology |
ecotope |
biosphere |
|
chaos
ecology |
opportunities |
individual strategies for survival |
|
|
|
|
|
Figure
12 Ecologies |
||
|
|
||
The
sequence in this summary may reflect a decreasing human centred approach as we ask
from urbanists on their way from environmental scientists into designers of
biotope cities or even further. In that perspective of urban ecology it is
important to understand the differences to avoid debates that paralysed
thinking about nature policy in the Netherlands for years.
Mechtild de
Jong describes in her thesis[aa]
the strikingly separated Dutch development of the last four categories in Figure 12 during the 20th century. The clearest
controversy - between the ‘holistic-vitalistic’ synecology and the ‘dynamical’
systems ecology - represents a beautiful example of spatial dispersion in one
species causing scientific diversity. Synecology primarily developed in the
Catholic University of Nijmegen (Westhoff) extending to Wageningen University
of Agriculture in the higher East of The Netherlands while ‘dynamic’ ecology
originated from the National University of Leiden (Baas Becking) in the wet
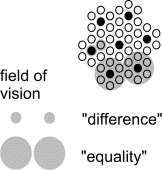
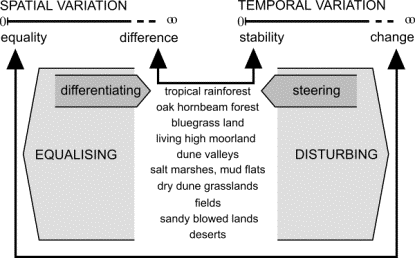
lower West area. The ‘cybernetic ecology’ originated from my teacher and
predecessor in Delft Van Leeuwen commuting between East and West. In his
lectures he stressed variation in space running from equality into difference
and in time from stability into change.
|
|
|
|
|
Figure 13 Spatial and temporal variation in
the theories of Van Leeuwen[bb] |
|
|
The
practical implications of his ‘relation theory’ made him popular amongst architectural
and urban designers in Delft and amongst managers of nature reserves. They
recognised steering devices, ‘selectors’ like basin, lid and gutter stressing
rather boundaries and conditions we can draw then the surrounded systems
developing inside after realisation of a design. Selectors determine the
openness and closedness of systems[cc],
especially when they are bordered vaguely (gradients). Van Leeuwen’s botanical
field knowledge was generally recognised as ‘phenomenal’. Both theoretical and
practical qualities got him a honorary doctorate in the University of Groningen
(1974). However, some ten years later in the same University a mathematically
oriented thesis[dd] showed
methodological weaknesses in his theories (to be found in other ecological theories
as well). After decades of means directed and conditional relation
theoretical applications in national planning[ee]
the more aim-directed and operational holistic-vitalistic approach with
predictable states of synecology became dominant. The general nature policy in
The Netherlands now is based on aimed nature types. The ‘completeness’ of a
natural reserve determines its support by government.
Nevertheless,
Van Leeuwen’s boundary-oriented conditionality rather than operational
causality in systems supposed by aim-directed managers keeps the designer
fascinated. A house should not cause a household, it should make many
households possible, whatever household may come.
I was
fascinated by the difference in logical mode between possible and probable futures.
Anything that is probable is per definition in the same time possible, but not
anything possible is also probable. Designers are asked to study improbable
possibilities, probable futures after all can be opened up by classical
forecasting research. This controversy between designing and forecasting in
Faculties of Architecture meets the difference between conditional and
operational thinking Van Leeuwen often mentioned. The city creates conditions
(possibilities) for different societies, it should not cause a (probable)
community. So, a nature reserve should offer conditions for different kinds of
nature. After all we appreciate nature by its own dynamics not influenced or
even planned by man. Nature offers an escape from planned space and time. The
Dutch word for cinema, ‘bioscoop’ means ‘looking life’ (bios), an escape from
our own living. We have to live without loosing life going by itself.
The
methodological problems of relation theory can be solved by scale-articulation
of concepts like variation in space and time. They become scientifically
operational by naming their scale. Perhaps scale-articulation even solves the
controversies of Dutch ecology. By that I can live with different ecologies as
long as they do not create myths like not comprehended chaos theory sometimes
did.
|
nominally |
abiotic |
biotic |
|
kilometres radius |
|
|
|
10000 |
earth |
biomen |
|
1000 |
continent |
areas of
vegetation |
|
100 |
geomorphological
unit |
flora-counties |
|
10 |
landscape |
formations |
|
metres |
|
|
|
1000 |
hydrological unit,
biotope |
ecological groups |
|
100 |
soil complex,
ecotope |
communities |
|
10 |
soil unit |
symbiosis |
|
millimetres |
|
|
|
1000 |
soil structure and
~profile |
individual
survival strategies |
|
100 |
coarse gravel |
specialisation |
|
10 |
gravel |
integration |
|
1 |
coarse sand 0,21-2 |
differentiation |
|
micrometres (m) |
|
|
|
100 |
fine sand 50-210 |
multi-celled
organisms |
|
10 |
silt 2-50 |
single-celled
organisms |
|
1 |
clay parts < 2 |
bacteria |
|
0,1 |
molecule |
virus |
|
|
|
|
|
Figure
14 Ecological units |
||
|
|
|
|
Figure 14 is a preliminary and rough attempt to name abiotic
and biotic components by scale. Any level of scale has its own nameable
diversity and dynamics. It has to be discussed, elaborated and renamed by
ecologists more precise. Perhaps different approaches in ecology appear to have
their own level of scale, accessible to designers giving measure to the urban
context on that scale. On different levels of scale we could need different
approaches; for example:
• R=300m
Ecological groups in ecotopes
• R=30m
Communities in biotopes
• R=3m
Symbiosis and competition
• R=30cm
Individual survival strategies
7
The condition of measure
Open space
in the Netherlands is reduced by 12.5% urban and rural built area for
16 000 000 inhabitants with ample 300 m2 average built area per
person. When these inhabitants were concentrated in 16 conurbations of
1 000 000 inhabitants each within 10km radius (see Figure 9) - regularly dispersed over the country - 10 open
landscapes with a free horizon of 30km radius would be available as open space.
They would be accessible within 10km from everybody’s house. In empty spaces of
that measure bears and eagles could find their habitat and the weekends could
be filled by survival journeys we now look for in other countries once a year.
However,
agriculture and urban sprawl have filled these potentially open landscapes. If
we name an area of 30km radius still a landscape as long as there are less then
1 000 000 inhabitants, The Netherlands still have 10 landscapes (see Figure 15). But not for long, because there are landscapes with
nearly 1 000 000 inhabitants and great pressure of urban sprawl. The size of spots in Figure 15 meets the average urban density in The Netherlands.
So, where they overlap the density is higher than average.
|
|
|
|
|
Figure
15 Built and open space in The Netherlands |
|
|
From Figure 15 we can conclude that concentration within
conurbations (r=10km) does not help much in keeping landscapes open. Regional
concentration (r=30km) does. Regional deconcentration breaks landscapes up into
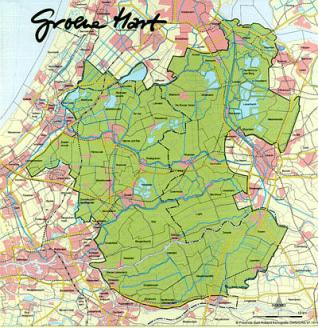
landscape parks or urban landscapes like happened in the Green Heart of
Randstad (recently named green metropolis or Deltametropolis). However,
deconcentration within conurbations (r=10km) could help making biotope cities.
What kind of biotopes are they?
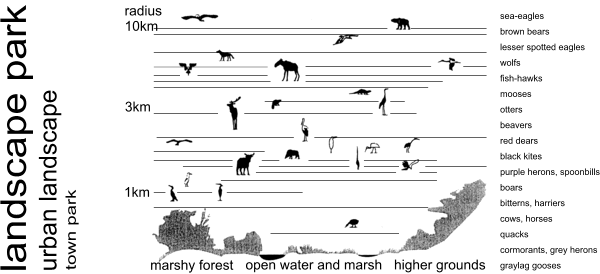
Form, size
and structure of components are conditions for the function of open areas
though urban functions on their turn can be the historical cause of form and
structure. The landscape consultancy H+N+S in Utrecht visualised the functional
charge for nature as a function of size and altitude in Figure 16.
|
|
|
|
|
Figure
16 Possibilities
for nature by size and altitude |
|
|
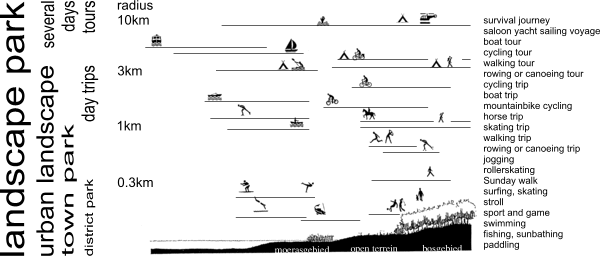
In Figure 17 they summarised possibilities of human recreation.
|
|
|
|
|
Figure
17 Possibilities
for recreation by size and altitude |
|
|
The smaller
the area the less animals could find a habitat, but that is not the case for botanical
biodiversity as far as their distribution is not dependent on animals.
|
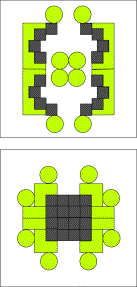
|
|
|
|
Figure 18 25% Central green area equally dispersed on
7 levels of scale |
|
|
A crucial space-time dilemma of urban planning is priority for
either small open spaces nearby residential areas or remote larger ones with
more travel time and a small profit of species.
If on
7 levels of scale from r=30m until r=30km any built area should be adjacent to
at least one central open area of the same size (see Figure 18), approximately 75% of total surface would be
occupied by built space and 25% by open space. The largest open space would
occupy 10 of that 25%, the 6 next smaller ones together 6 of the 25%, the 36
even smaller ones 3% and so on. The relative large amount of space token by the
largest one is an economic argument for more small ones near by home. However
this strategy would stress botanical rather then zoological biodiversity. Moreover,
a priority for smaller green spaces nearby home with a smaller emphasis on
animals brings nature closer to the inhabitants, especially the young ones.
Ecological
infrastructure could be important for distribution of animals with a larger
feeding ground or reproduction area then the same areas not connected. However
its effectiveness is species specific and not convincingly proven. Their
surface could be at the expense of larger concentrated areas.
|
|
|
|
Open area concentrated but
isolated |
The same area connecting but
deconcentrated |
|
Figure 19 The surface dilemma of
concentrating or connecting |
|
|
|
|
Tummers and
Tummers-Zuurmond[ff] defend
central open areas instead of peripheral dispersion.
8
Urban ecology
Since 19th
century’s hygienic developments in the urban area[gg]
- the very source of public housing policy and urban design - biodiversity in
spaced towns outruns rural biodiversity.
|
|
|
|
|
Figure
20 Number of wild plant species per km2 in the lower
and higher part of The Netherlands |
|
|
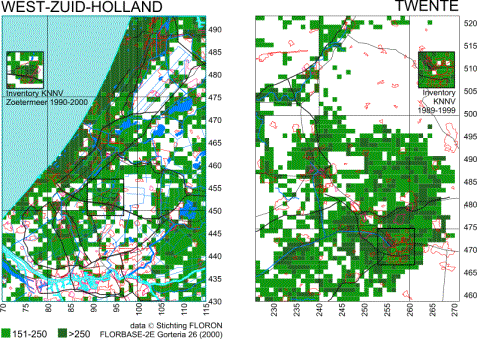
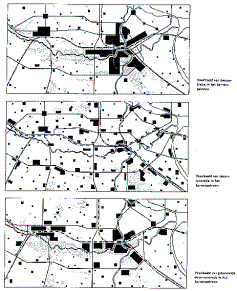
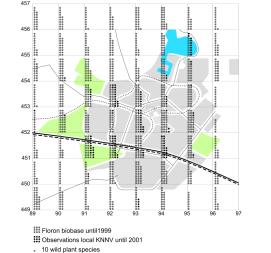
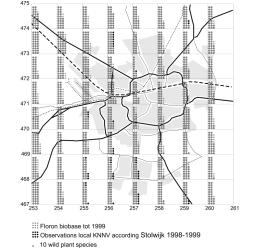
Figure 20 shows that some square kilometres in the urban area
of Zoetermeer indicated in the left picture have more that 250 wild plant
species per km2. Local observers (inset KNNV)[hh]
counted even more then national ones (FLORON). The urban area of Zoetermeer is
more in contrast with the rural environment characterised by cattle breeding
then Enschede (indicated in the right picture) surrounded by more natural
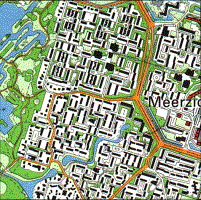
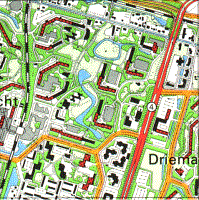
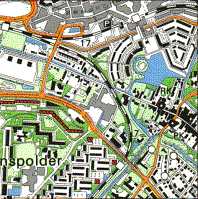
equally rich areas. Figure
21 shows both in more detail. Here we can see that
infrastructure and industrial areas contribute more then we would expect by
intuition. Their verges, slopes and rough grounds are less visited and
disturbed by man and pet.
|
|
|
|
|
|
|
Figure
21 Number of plant species per km2 in Zoetermeer and
Enschede |
|
|
|
|
The number
of species per km2 is added up over several years. So, many species could have
been disappeared, they then only show the urban potential. Moreover, some square
kilometres could have been observed better then other ones, for example the
outskirts.
|
|
|
|
|
180 |
200 |
330
wild plant species |
|
low-rise outskirts |
high-rise |
centre |
|
Figure
22 Number of wild plant species in 3 km2 of
Zoetermeer |
||
|
|
|
|
Even
when in the centre the plant observations were better then in the outskirts, Figure 22 warns us for the intuitive view that biodiversity
always decreases from the outskirts into the centre. The large number of
observed species in the central km2 could also be explained by urban
age, abiotic variation like seepage, drainage, water level or intersection by infrastructure with verges and slopes, less
influence of adjacent agriculture and manure of cattle breeding dispersed by
water or wind.
So,
some of these possible causes could be varied as means of design aiming urban
biodiversity.
|
Effective
variation for botanical biodiversity |
in a radius of approx. |
|
altitude, ground |
30km |
|
soil, water management |
10km |
|
seepage, drainage, water
level, urban opening up |
3km |
|
The next levels are still hidden for botanical observation
usually sampled per square km. |
|
|
urban lay-out |
1km |
|
parcelling (distribution
of greenery) |
300m |
|
pavement, tread, pet
manuring, minerals |
100m |
|
altitude differences, mow
management, disturbance |
30m |
|
sun lighting |
10m |
|
|
|
|
Figure
23 Scale-articulated
hypotheses of effective abiotic variation producing botanical biodiversity |
|
|
|
|
Figure 23 shows possible working factors in urban design per
level of scale. These hypotheses should be examined and evaluated yet.
Accepting that the character of botanical diversity can not be predicted, one
could question whether urban biotopes are valuable at all compared with rural
nature. Figure 24 arranges some 500 urban plant species from the 1500
known in The Netherlands in a sequence of national rareness, naming 50 of them
only. Their national presence in % of the 5x5km observation squares is
recognisable in the rising line. The spots show the urban presence in % of
1x1km observation squares in Zoetermeer. So, the spots above the line are more
common in Zoetermeer than in The Netherlands, the spots below less so.
|
|
|
Figure
24 Local rareness of approximately 500 plant
species in a sequence of national rareness |
|
|
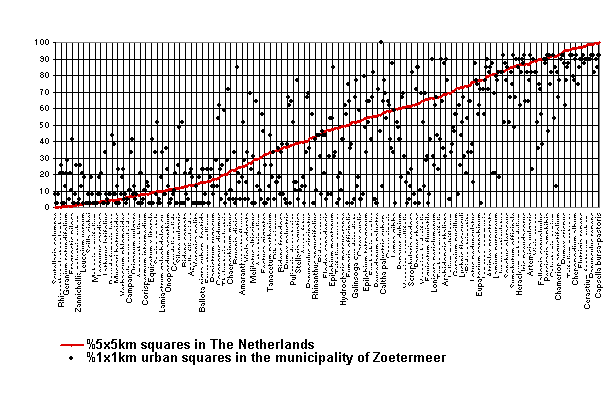
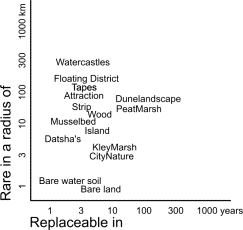
A
number of nationally rare plant species in the left side of the graph evidently
found their place in urban ecotopes. In the wake of urban plants and ecotopes rare
insects and fungi have been observed in Zoetermeer[ii],
but seldom nationally rare vertebrates.
9
Typing urban biotopes or ecotopes
Ecological
typology is scale-sensitive. On a global level (r=10 000km) year average
temperature and precipitation determine so-called ‘biomen’[jj].
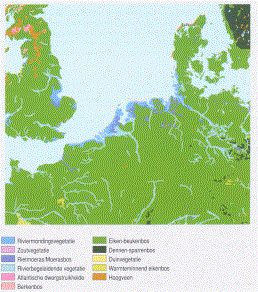
On a continental level (r=3 000km) areas of vegetation like estuaries, salt
vegetations, reed marsh, river accompanying, Atlantic heather, birch forest, oak-beach forest, pine-spruce forest,
dunes, warm oak forest and high moor land are distinguished[kk].
On a map types in a typology appears like legend-units in a legend (see Figure 25).
|
|
|
|
|
|
|
|
|

On a national
level in The Netherlands Holocene and Pleistocene are the most enclosing
categories approximately separated by the 5m altitude or clay (with peat and
dunes) versus sand (intersected by river clay or locally filled by high moor
land). The most urbanised Holocene estuary area, botanically indicated as
‘lagoon county’ is highly influenced by man and in the same time an
internationally rare cultural-natural monument of polders. It is ecologically
divided further in many ways representing its dynamic and unpredictable wet
ecological diversity.
|
|
|
|
|
|
|
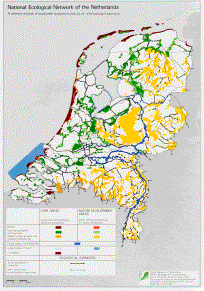
Figure 26 Planning Ecological
Infrastructure[mm] |
Figure 27 International rareness of
landscapes[nn] |
|
|
|

The synecological
typology by which the 132 national aimed nature types of the ecological
infrastructure (EHS) are defined[oo]
proved to be inadequate earlier for the Holocene Zuid-Holland area[pp].
Too many transitional stages between sand, clay and peat, influenced by a
historical local diversity of cutting peat and water management produced a
variety of nature types nearly equalling the number of grounds itself.
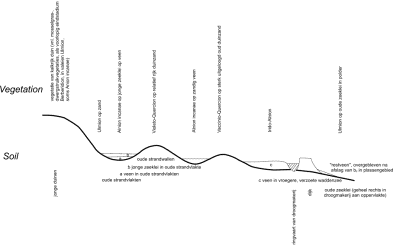
Regional
ecological units in the Holocene are based on soil characteristics, highly
influenced by altitude in ‘formations’, causing dynamic local communities.
|
|
|
|
|
|
|
Figure 28 Formations mid-west of The
Netherlands |
|
|
|
|
Within
these ecological contexts the urban area has to find its own ecological typology.
Its unpredictable ecological riches and potential urges to a more conditional
approach like ecotopes and ecological groups[qq]
rather then a causal one by biotopes and communities being ‘complete’ or not.
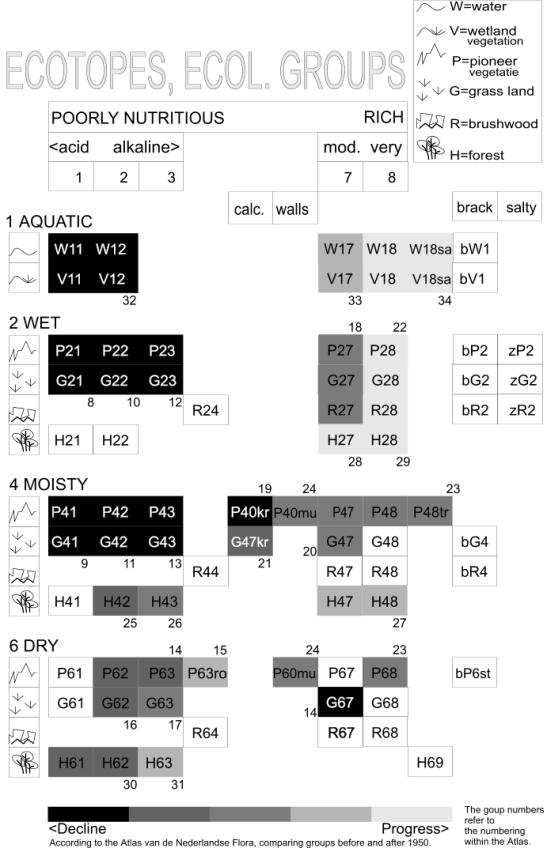
A more
conditional typology (see Figure
31) based on moist, sun lighting by vegetation height
and nutritional value of the soil does not predict aimed communities but
rareness. It stresses conditions to be influenced by urban design. Rareness is
also culturally useful because it makes cultural values comparable with
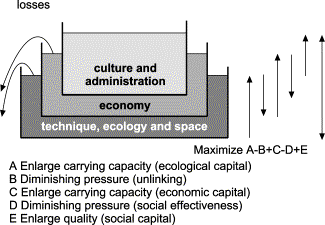
ecological ones (Figure 29). Conditionality represented by tanks filled with
liquids of different specific gravity clarifies a possibility evaluating
categories of nature and culture (Figure
30).
|
|
|
|
|
|
|
|
|
|
|
Figure
31 Ecotopes or ecological groups |
|
|
10 Urban
perspectives
The urban
growth since the industrial revolution culminates, especially in the developing
countries where the European hygienic history of towns repeats itself.
Restricting ourselves to the present Dutch situation claims on Randstad are
bigger then ever and the idea of an open Green Heart fades away by urban
sprawl.
|
|
|
|
|
|
|
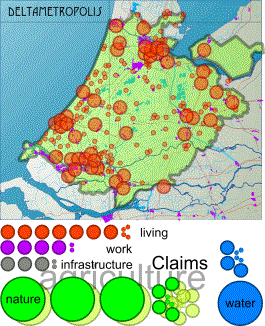
Figure 32 Claims on Detametropolis area |
Figure 33 The supposed Green Heart |
|
|
|
The 30 years
old idea of high density conurbations have not been successful in spite of
national strategies like bundled concentration or compact cities. And if so,
they would have been not effective (see Figure
9) in saving surrounding landscape. It is an example of
ideas like high tech transportation solutions that have big metropolises as a
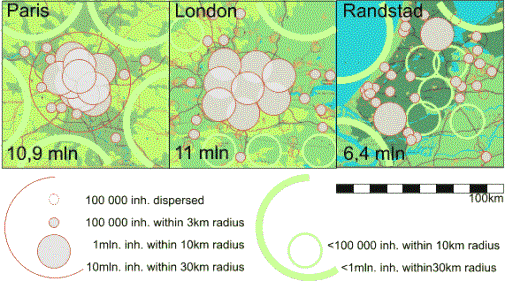
reference. However, Randstad does not yet reach the capacity of a real
metropolis making fast underground systems possible.
|
|
|
|
|
Figure 34 The capacity of metro poles |
|
|
From an
ecological point of view the condition of measure (see paragraph 7 on page 10) is less important when we concentrate on vegetation
rather than on big animals. From a human point of view we should bring nature
closer to home (see page 13). That pleads for openness within the agglomeration
and not for accumulation on every level of scale.
11 Human health in
the urban environment
Being
no expert on human health the most extensive overview I know in the joint field
of medicine and urbanism is edited by Vogler and Kuhn[tt]
some 50 years ago. They discuss many kinds of ‘civilisation damage’ in the
urban environment from different medical specialist’s points of view. I never
found a reference into this comprehensive work and I can understand it
considering its size and age. So, I recoil from reviewing it as well, the more
so while I am not read up on more recent medical literature. Apart from the
disadvantages of living in high densities Vogler and Kuhn emphasise, its
benefits Jane Jacobs[uu]
some years later referred to were partly confirmed in a psychological sense.
Freedman[vv] discussed research
on crowding and behaviour concluding no other impact of increasing density than
intensifying existing negative or positive social-psychological processes.
However, by human biodiversity or social diversity - stage in the lifecycle,
income or life style - some people like to live in high densities, others do
not. People with children mostly like low densities of quiet suburbs. So,
forced to live in high densities the impact could be primarily negative.
However, learning to live in high densities with children might turn out
positive by discovering advantages, adapting, compensating shortages and
accommodating new functions.
Adapting
to an environment and compensating shortages by new accommodations are essential
characteristics of life. Life would never have developed without these
capacities. The possibility of adaptation and compensation are often forgotten
by researchers only interested in forecasting. ‘Arsenic is poisonous’, they
predict. The prediction is based on 3x standard deviation from the average
(99.7% of the cases) and if arsenic poison would be ever a global problem their
solution would be removing the cause only. But in Austria a village population
of so called ‘arsenic eaters’ (source unknown) since centuries got used to it.
That is the way evolution solved problems by adaptation and compensation
increasing diversity, not by global rules reducing diversity. Oxygen was once a
global poison, now it is a prerequisite for aerobic life. Adapting,
compensating and accommodating are also ways designers study. When low
temperature is a problem of living in higher latitudes we compensate
(accommodate) by building acclimatised houses. It is unnatural because it
disturbs the natural distribution and abundance of homo sapiens. But since we
make houses more than 3000 years it appears natural to us. What we call
‘natural’ apparently is time scale sensitive as well.
Epidemiological
research seldom succeeds in convincingly separating causal physical context
factors like the urban environment from other coinciding influences affecting
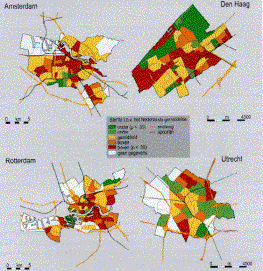
health. Death rates in the big towns in the nineties were 11% higher than
elsewhere in The Netherlands and there are substantial health differences
between and within towns (Figure 35) [ww].
However, they correlate highly with income differences causing different
(un)healthy lifestyles. For example they indicate that in a low-income district
the chance to die before the age of 65 is 50% higher than in a high-income
district. And rich people move from low-income wet peat and clay districts into
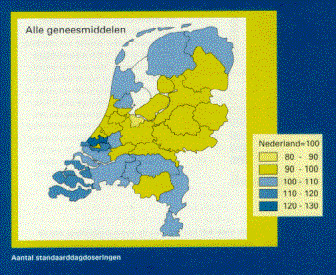
high-income sandy districts leaving a less healthy population behind. A recent
survey into medicine use shows that the most well-to-do sandy region ‘Gooi’ has
the lowest use of medicines in The Netherlands[xx]
(Figure 36). Insurance companies could decrease their rates for
these groups in the same time increasing their wealth (and health). But to
which extend Gooi-people owe their health to wealth and life style, to lower
housing density, to green area in their direct neighbourhood, dry sandy soil or
climate we do not know. The surveyors did not try to explain either comparing
regions of The Netherlands because epidemiological research is one of the most
tricky disciplines urging expensive longitudinal research extending decades to
be convincing. That is a great pity, because as long as statistical evidence
fails an even more tricky branch of statistics wins: risk calculation. Risk
calculation seems rational, but often it is also the calculation of fears and
myths motivated by little more then sharing them in collective fear.
|
|
|
|
|
|
|
Figure 35 Differences in death rates |
Figure
36 Use of medicines |
|
|
|
The
more we know, the more possible threads we become aware of to be calculated.
That raises fear and fear raises stress. Stress is suspect in raising or stimulating
diseases like cancer. Fear for cancer is so well-known a medical symptom that
it got its own name in medical vocabularies: ‘carcinophobia’. Designers in the
wake of this uncertainty already try to
make solutions for possible problems. That is their task, but they seldom
evaluate the effectiveness and possible side-effects of their solutions. Urban
design is not always the most effective solution in environmental problems
remaining after the great positive health effect of housing itself. Barton and
Tsourou[yy]
advise 12 key health objectives for urban planners in the context of WHO
healthy city project in which Eindhoven participates: healthy lifestyles,
social cohesion, housing quality, access to work, accessibility, local
low-input food production, safety, equity, air quality and aesthetics, water
and sanitation quality, quality of land and mineral resources, climate
stability. Evaluating their effectiveness again would urge expensive
longitudinal research extending decades to be scientifically convincing.
There
is something wrong in the state of medicine. King Average rules the kingdom of
exceptions human species comprises, but in the same time exceptional
occurrences are magnified by television and newspapers. Television and
newspapers bomb us by statistical exceptions, distorting our perception of
chance and magnifying impact. Risk is popularly defined by chance times impact.
The public shame of few physicians involved intimidates the profession as a
whole. And we still know little about our body, our own nature yet. Honest
physicians remain silent but that is what frightens more. Avoiding any risk
physicians prescribe too many medicines, order too many physical examinations
increasing the costs of medical care, increasing slowly appearing side effects.
Avoiding any risk raises new risks on other levels of scale. Always avoiding to
catch a cold may result in high susceptibility for flu any time we leave a
building or a car. Our hygiene drove life out and nature in exile. Our
biological resistance fades, the number of immunity deficiency diseases
increases. We do not get injuries enough to become vaccinated by nature itself.
We like dangerous holydays to flee from our unnatural and boring safety, but we
do not know real danger anymore and fall ill by foreign food.
A
secret medical survey I heard of by a medical student in the seventies revealed
that half of our diseases at that time were iatrogeneous (caused by
physicians). I do not know whether that was true or not and what the present
state of medicine is in this respect. That is why I fear the worst case.
Insurance companies sell fear. We pay more for safety than for anything else:
insurance, police, army, preventing fire, burglary and catching a cold. We fear
we can not pay all and we double our work until we die from the impacts of
stress. The life time we spend on worry is lost well-being, lost health and
life time. Our fear for exceptional possibilities raises new diseases of the
mind and we fear them as well. In reality our life is safer then ever, but we
do not dare to live with life: the risk to die. Life became strange to us and
death as well, we fear the unfamiliar because it could be unhygienic.
In the
mean time numerous other organisms are going their own way, not fearing for
anything that is not actual and mostly without any apparent fearing at all.
They live from very slow to very fast.
I
prefer the slow living plants surrounded by their very fast pairing messengers
of life-experience, the insects. Plants are the basis of life’s pyramid. Added
animal life only selects and regulates like man does as well by harvesting,
preserving, mowing and gardening. Sometimes we visit them and walk in something
totally else we belong to historically but do not have to understand, something
we should not try to plan.
I
think it stimulates human health when we bring life close to everybody’s home
and living, but nobody knows, it is a hypothesis. Berg et al. give an excellent
overview in their essay about the relation between nature and health[zz]
concerning history, possible impacts on stress, fear, physical resistance and
personal growth. Nature puts the stressing concept of our own importance into a
relative perspective of one species between 1 700 000 ones or more. They differ
more from us than any people we tend to reject in social conflict. Nature
tempers forced choice as architecture should do as well[aaa].
The
intellectual challenge of this century is to handle diversity instead of
generalising it by statistical reduction. Generalising research has diminishing
returns, on the other hand design is promising, generating study. Evolution and
ecological succession is its model. Studying nature heals social disappointment
by disappointing presuppositions, prejudices. It stimulates an active form of
modesty. The more we know about nature the more we appear to know not, and the
more we want to know, to see, to experience. In any town of The Netherlands
specialised study groups of nature associations contribute to atlases of birds[bbb],
butterflies[ccc], bats[ddd],
amphibians and reptiles[eee],
mammals[fff],
fishes[ggg],
plants[hhh]
and mushrooms[iii]
multiplying our shrinking world of holiday destinations by growing local
universes we tended to overlook. In any town nature writes a history of war and
peace far more thrilling than television and newspapers could do.
Nature
looks for its journalists because it only exists by the grace of those seeing
it.
12 Conclusions
concerning spatial human rights
A.
Any
human has a right on 300m2 residential area in a radius of 10km, work and
services included.
B.
Any
human has a right on all necessary sources of living within a radius of 30km.
These sources have to give access to products of 2000m2 agricultural land per
person. This land should be accessible within a radius of 1000km concerning the
risk of stagnating logistics.
C.
Agriculture
has to be located in areas with highest supply of water, minerals and sunlight.
Towns and untilled natural areas have to be located in areas with less
minerals.
D.
Any
human has a right on untilled natural ground uninhabited by man within a radius
of x from her or his place of residence measuring at least a radius of x/3; x
being {0.3, 1, 3 … 100 000 metre}.
E.
Dutch
cities belong to the most healthy in the world. So, any attention given to
health in Dutch cities is distressing in a perspective of the hygienic
condition of cities in the second and third world.
References
Ali Cohen, L., Ed. (1872) Handboek der openbare gezondheidsregeling
en der geneeskundige politie met het oog op de behoeften en de wetgeving van
Nederland. (Groningen) J.B. Wolters.
Bal, D., Beije, H.M., Hoogeveen,
Y.R., Jansen,S.R.J., Reest, P.J. van
der (1995) Handboek natuurdoeltypen in
Nederland, Bijlagen. (Wageningen) Informatie en kenniscentr.nat.beh.LNV.
Bal, D., H. M. Beije, et al., Eds.
(1995) Handboek; Natuurdoeltypen in
Nederland. (Wageningen) IKC Natuurbeheer / Min. van Landbouw en Visserij.
Barton, H. and C. Tsournou (2000) Healthy urban panning. A WHO guide to
planning for people. (London, New York) Spon Press.
Batenburg-Eddes, T. v. and A. v. d.
Berg-Jeths (2002) Slikken in Nederland.
(Bilthoven) RIVM rapportnummer 270556005.
Begon, M., Harper, J.L.,Townsend,
C.R. (1996) Ecology. (Oxford)
Blackwell Science.
Beintema, A., O. Moedt, et al.
(1995) Ecologische Atlas van de
Nederlandse Weidevogels; m.m.v. SOVON. (Haarlem) Schuyt & CO BV.
Bekhuis, J., R. Bijlsma, et al.,
Eds. (1987) Atlas van de Nederlandse
Vogels. (Arnhem) SOVON.
Bense, M. (1954) Aesthetica. (Stuttgart) Deutsche
Verlags-Anstalt.
Berg, A. E. v. d., M. M. H. E. v. d.
Berg, et al. (2001) Van buiten wordt je
beter. (Wageningen) Alterra, bijlage bij het jaarboek 2001.
Bink, F. A. (1992) Ecologische Atlas van de dagvlinders van
Noordwest-Europa. (Haarlem) Schuyt & CO BV.
Birkhoff, G. D. (1933) Aesthetic measure. (Cambridge, Mass.)
Harvard University Press.
Bohemen, H. D., D. A. G. Buizer, et
al., Eds. (1986) Atlas van de Nederlandse
amfibieën en reptielen. (Hoogwoud) KNNV Uitgeverij.
Bohn, U. (2001) Karte der natürlichen Vegetation Europas. Map of the Natural Vegetation
of Europe. (Bonn) Bundesambt fur Naturschutz.
Broekhuizen, S., B. Hoekstra, et
al., Eds. (1992) Atlas van de Nederlandse
zoogdieren. Natuurhistorische Bibliotheek van de KNNV. (Utrecht) KNNV
Uitgeverij.
Brundtland, W. C. o. E. a. d. o. C.
(1987) Our common future. (Oxford-New
York) Oxford University Press.
Dieckmann, U., R. Law, et al. (2000)
The Geometry of Ecological Interactions:
Simplifying Spatial Complexity. (Cambridge) Cambridge university press.
Eyck, A. E. v., P. Parin, et al.
(1968) Via 1, Ecology in Design /
Kaleidoscope of the mind / Miracle of Moderation / Image of Ourselves.
(Philadelphia) Graduate School of fine arts, University of Pensylvania.
Freedman, J. L. (1975) Crowding and behavior. (San Francisco)
W.H.Freeman and Company.
Fukuyama, F. (1992) The End of History and the Last Man.
(New York) Free Press.
Garretsen, H. F. L. and H. Raat
(1989) Gezondheid in de vier grote steden.
('s-Gravenhage) SDU uitgeverij.
Grime, J. P., J. G. Hodgson, et al.
(1988) Comparative Plant Ecology.
(London) Unwin Hyman.
Hagemeijer, W. and M. J. Blair, Eds.
The Atlas of European Breeding Birds.
(London) Poyser.
Held, A. J. d. and P. H. M. A.
Clausman (1985) Het vegetatieonderzoek
van de provincie Zuid-Holland. Deelrapport III. De vegetatietypologie van
Zuid-Holland. Deel A, de Watervegetaties (met bijlage). (Den Haag)
Provincie Zuid-Holland.
Houwaart (1991) De hygienisten. Artsen, staat & volksgezondheid in Nederland
1840-1890. (Groningen) Historische Uitgeverij Groningen.
Jacobs, J. (1961) Death and Life of Great American Cities.
(New York) Random House.
Jong, M. D. T. M. d. (2002) Scheidslijnen in het denken over
Natuurbeheer in Nederland. Een genealogie van vier ecologische theorieen.
(Deft) DUP Science.
Jong, T. M. d. (1985) Programma NNAO scenario. (Den Haag)
Stichting Meso and Sociaal-geografisch instituut UvA.
Jong, T. M. d. (2001) Ecologische toetsing van drie visies op
Almere Pampus. (Zoetermeer) MESO.
Jong, T. M. d. and H. Priemus (2002)
Forecasting and Problem Spotting. in: T. M. d. Jong, Y. Cuperus and D. J. H. v.
d. Voordt, Ways to study and research
urban, architectural and technical design (Delft) DUP.
Jong, T. M. d. and D. J. M. v. d.
Voordt, Eds. (2002) Ways to study and
research urban, architectural and technical design. (Delft) DUP Science.
Jong, T. M. d. and J. Vos, Eds.
(1995) Kwartaalbericht KNNV
Zoetermeer 1-10. (Zoetermeer) KNNV Zoetermeer.
Jong, T. M. d. and J. Vos, Eds.
(1998) Kwartaalbericht KNNV
Zoetermeer 11-20. (Zoetermeer) KNNV Zoetermeer.
Jong, T. M. d. and J. Vos, Eds.
(2000) Kwartaalbericht KNNV
Zoetermeer 21-30. (Zoetermeer) KNNV Zoetermeer.
Jong, T. M. d. and J. Vos, Eds.
(2003) Kwartaalbericht Natuurgroep
Zoetermeer 31-40. (Zoetermeer) Natuurgroep Zoetermeer.
Kolasa, J. and S. T. A. Pickett
(1991) Ecological Heterogeneity. (New
York) Springer-Verlag.
Krebs, C. J. (1994) Ecology the experimental analysis of
distribution and abundance. (New York) Harper Collins College Publisher.
Krupp and Helmar (1995) European Technology Policy and Global
Schumpeter Dynamics: A Social Science Perspective Technological Forecasting and
Social Change 48, 7-26. (New York) Elsevier Science Inc.
Krupp, H. (1996) Zukunftsland Japan, Globale Evolution und
Eigendynamik. (Darmstadt) Wissenschaftlicht Buchgesellschaft.
Leeuwen, C. G. v. (1964) The open- and closed theory as a possible
contribution to cybernetics. (Leersum) Rijksinstituut voor Natuurbeheer.
Leeuwen, C. G. v. (1973) Ekologie. (Delft) TH-Delft, Afd.
Bouwkunde.
Limpens, H., K. Mostert, et al.,
Eds. (1997) Atlas van de Nederlandse
vleermuizen; Onderzoek naar verspreiding en ecologie. Natuurhistorische
Bibliotheek van de KNNV. (Utrecht) KNNV Uitgeverij.
LNV (2002) Structuurschema Groene Ruimte 2. Samenwerken aan groen Nederland.
(Den Haag) Ministerie van Landbouw en Visserij.
Londo, G. (1997) Natuurontwikkeling; Bos- en Natuurbeheer in
Nederland. (Leiden) Backhuys Publishers.
Lucht, F. v. d. and H. Verkleij,
Eds. (2002) Gezondheid in de grote
steden. Achterstanden en kansen. (Houten) Bohn Stafleu Van Loghum.
Luhmann, N. (1973) Zweckbegriff und Systemrationalität.
(Ulm) Suhrkamp Taschenbuch Wissenschaft.
Meijden, W. (1993) Verspreiding en natuurwaarden van
ecotoopgroepen in Nederland. Onderzoek effecten grondwaterwinning 6.
(Bilthoven) RIVM.
Meijden, W. G. (1992) Toetsing van de verspreiding van
ecotoopgroepen aan het LKN-bestand. Onderzoek effecten grondwaterwinning.
(Bilthoven) CLTM-rapport 92 RIVM.
Mennema, J., A. J.
Quene-Boterenbrood, et al. (1980) Atlas
van de Nederlandse flora deel 1. (Amsterdam) Kosmos.
Myers, N. (1985) Spectrum atlas van de aarde. (Utrecht)
Het Spectrum.
Nauta, M. M. and E. C. Vellinga
(1995) Atlas van de Nederlandse
paddestoelen. (Rotterdam) A.A. Balkema Uitgevers BV.
Nie, H. W. d., Ed. (1996) Atlas van de Nederlandse zoetwatervissen.
(Doetinchem) Media Publishing Int BV.
Philp, R. B. (2001) Ecosystem and human health
Toxicology and Environmental Hazards. (New York) Lewis Publishers.
Pianka, E. R. (1994) Evolutionary Ecology. (New York) Harper
Collins College Publishers.
Riemsdijk, M. J. v. and NOBO, Eds.
(1999) Dilemma's in de bedrijfskundige
wetenschap. (Assen) Van Gorcum.
RIVM (2001) Natuurbalans 2001. (Alphen aan den Rijn) Kluwer.
Runhaar, J., C. L. C. Groen, et al.
(1987) “Een nieuwe indeling in
ecologische groepen binnen de Nederlandse flora.” Gorteria 13(11/12): 277-359.
Russell, B. (1919) Introduction to mathematical philosophy.
(London and New York) Routledge.
Schaminee, J. and A. Jansen, Eds.
(2001) Wegen naar Natuurdoeltypen 2
Ontwikkelingsreeksen en hun indicatoren voor herstelbeheer en
natuurontwikkeling (sporen B en C). (Wageningen) Expertisecentrum LNV,
Alterra, KIWA, SOVON.
Sloep, P. B. (1983) Patronen in het denken over vegetaties. Een
kritische beschouwing over de relatietheorie. (Groningen) Stichting
Drukkerij C. Regenboog.
Steekelenburg, M. v. (2001) Self-sufficient world. (Den Haag)
Rijksplanologische Dienst (RPD).
Structuurschets, S. G. (1983) .
Tax, M. H. (1989) Atlas van de Nederlandse dagvlinders.
('s-Graveland / Wageningen) Vereniging tot behoud van Natuurmonumenten in
Nederland / Vlinderstichting.
Tjallingii, S. (1996) Ecological conditions. (Wageningen) DLO
Institute for Forestry and Nature Research (IBN-DLO).
Tummers, L. J. M. and J. M.
Tummers-Zuurmond (1997) Het land in de
stad. De stedebouw van de grote agglomeratie. (Bussum) Uitgeverij Thoth.
Tweede_Nota (1966) Tweede Nota over de Ruimtelijke Ordening in
Nederland. ('s-Gravenhage).
Vogler, P. and E. Kuhn, Eds. (1957) Medizin und Städtebau. Ein Handbuch fur gesundheitlichen
Stadtebau. (Munchen, Berlin, Wien) Verlag von Urban & Schwarzenberg.
Weeda, E. J., J. H. J. Schaminée, et
al. (2000) Atlas van
Plantengemeenschappen in Nederland; Wateren, moerassen en natte heiden.
(Utrecht) KNNV, Alterra, CBS, LNV, KIWA, Directoraat-Generaal Rijkswaterstaat,
VEWIN.
Zoest, J. v. (1989) Biodiversiteit. (Utrecht)
KNNV-Uitgeverij.